Haifa M. Algethamy ¹ , Mohammed M. Aboudeif ² , Mohamed Amin M. Ali 3 , Ahmed M. Amin 4 , Shehla N. Amin 5
Authors affiliations:
Background & Objective: Though numerous biomarkers have been identified with diagnostic and/or prognostic value in sepsis patients; few are sensitive early enough to guide early decision-making. Presepsin (PSEP) appears to spike within the first few days of systemic bacterial infection. We evaluated PSEP’s sensitivity, specificity, accuracy, and area-under-the-curve (AUC) predicting sepsis-related mortality, both used alone and combined with other parameters.
Methodology: A prospective study was conducted of N = 84 adult sepsis patients admitted to critical care units (CCU) at a single, university-affiliated tertiary hospital. All were followed until either death or 90 days after CCU admission, with biomarkers including PSEP and procalcitonin (PCT) measured on days 1, 3, 5, 7 and 12. Bivariable analysis was conducted to identify potential predictors of mortality for use in multivariable analysis and ultimate evaluation of a mortality risk in sepsis summation score.
Results: Among 84 patients, 44 died, 12 remained hospitalized, and 28 were discharged home. At all five blood draws, PSEP levels were significantly higher in sepsis non-survivors than survivors, versus no instances with PCT. Multivariable analysis identified three statistically significant predictors of mortality: patient age, baseline SOFA score, and the average of patients’ day 1 and 3 PSEP levels. From these three variables, all attained within the first 72 hours of CCU admission, a 9-point scale was constructed that was 83.8% sensitive, 71.1% specific, and 77.3% accurate predicting ultimate sepsis-related mortality (AUC = 0.80).
Conclusions: Alone and combined with patient age and baseline SOFA score, early PSEP levels are highly sensitive and specific predicting sepsis-related mortality.
Keywords: Presepsin; Procalcitonin; Predictors; Mortality; Sepsis; SOFA
Citation: Algethamy HM, Aboudeif MM, Ali MAM, Amin AM, Amin SN. Comparing dynamic presepsin and procalcitonin measurements in septic adults: development and testing of a mortality risk in sepsis summation score. Anaesth. pain intensive care 2026;30(2):248-261. DOI: 10.35975/apic.v30i2.3134
Received: August 28, 2025; Revised: December 26, 2025; Accepted: January 01, 2026
According to data published by the World Health Organization (WHO), approximately 49 million cases of sepsis and more than 11 million sepsis-related deaths occur worldwide each year, with sepsis accounting for roughly 20% of all deaths.1 In patients with septic shock, mortality rates may exceed 40%.2 Though C-reactive protein (CRP) and procalcitonin (PCT).3-8 are most often used and studied, to date, over 250 different factors have been proposed as potential predictors of systemic sepsis and related outcomes, and this number continues to rise.5,9 This is largely because both CRP and PCT are non-specific, with levels rising in response to aseptic inflammation.5 This said, in a review of almost 5400 references, all published since 2010, among 258 sepsis biomarkers identified, only 40 had been compared against PCT and/or CRP, and only 26 in clinical trials with more than 300 patients.5 Of these, nine were found to outperform CRP and/or PCT, but none of these are widely used and only one (Group II phospholipase A2, PLA2-II) has been examined in a larger study. As such, to date, no ideal single marker or marker combination has emerged to aid in the diagnosis and prognostic stratification of sepsis patients.5, 6, 8-10 One biomarker that has been studied in larger studies and evaluated in meta-analyses as a potential predictor of both sepsis and mortality is presepsin (PSEP), which is what remains after cleavage of the N-terminal of soluble CD14. In numerous studies, PSEP has been found to predict both sepsis and mortality to a degree that is at least comparable to PCT and more specific than CRP.5, 8, 10-17 How PSEP might be advantageous over other sepsis biomarkers – like PCT, CRP, interleukin-1 (IL-1) and IL-6 – is that levels appear to spike earlier in the course of systematic sepsis and, as such, might be better at guiding early therapy.14
In this study, we measured levels of PSEP, PCT, and several other biomarkers at five time-points over the first 12 days after patients had been hospitalized for sepsis. Specific objectives were to: (a) determine whether PSEP actually does spike earlier than the other biomarkers; (b) determine whether multiple levels enhance its diagnostic and prognostic sensitivity and specificity; (c) compare its overall accuracy to PCT over five measurements spanning 12 days; and (d) develop and evaluate the sensitivity, specificity, accuracy, and area under the receiver operating characteristic curve (AUC) of a composite score of statistically-significant predictors of sepsis-related mortality.
The study was conducted in all critical care units at King Abdulaziz University Hospital in the city of Jeddah. All patients of age 18 years or older with either sepsis or septic shock admitted to a critical care unit within 24 hours of their sepsis being recognized using Sepsis-3 criteria.2 were considered for enrollment, provided either they or their next-of-kin provided informed written consent. Exclusion criteria were age less than 18 years; CCU admission more than 24 hours after recognition of their sepsis or septic shock; known or suspected pregnancy, negative culture result from the primary site of infection; lack of signed informed consent.
At the time of admission, all patients underwent a complete history and physical examination, a set list of baseline laboratories that included blood levels of PSEP, PCT, lactic acid, blood cell counts (red blood cells, leukocytes, lymphocytes, platelets), serum electrolytes, blood urea nitrogen (BUN) and creatinine, alanine transaminase (ALT), aspartate transaminase (AST), bilirubin, prothrombin time (PT), partial thromboplastin time (PTT), and international normalized ratio (INR). In addition, baseline scores for both the APACHE II and SOFA scales were calculated, both at the time of admission and 72 hours later. All the above-listed laboratory investigations were repeated on the third, fifth, seventh, and twelfth day after CCU admission. Both PSEP (sCD14-ST) and PCT values were measured using an immunoassay analyzer.
Two or more blood samples of 5-10 mL were collected cultures were collected from each patient on admission. Bacteremia was defined as recovery of any pathogenic bacterial species in one or two sets of blood cultures. Microorganisms commonly considered as contaminants were excluded from the bacteremia group.18 Cultures from any known or suspected site or source of infection also were collected, including sputum, urine, wound, and any device or inserted catheter, as clinically indicated, BUN, creatinine, AST, ALT, PT, INR, PTT, bilirubin (Total and Direct), random blood sugar, and serum sodium and potassium levels.
Patient management was at the discretion of the medical team, led by the attending CCU physician and aided, as needed, by attending infectious disease consultants, following 2016 Sepsis-3 guidelines.2
Every patient was followed until either death, hospital discharge, or the end of 90 days follow-up, whichever was longest in duration. The primary outcome of interest was clinical status 28 and 90 days after CCU admission and at final follow-up (if greater than 90 days). Primary outcomes were categorized as survival with discharge home; survival but either still or re-hospitalized; and mortality. Over the course of follow-up, the following additional clinical parameters were recorded; all released cultures, time of starting and stopping antibiotics, need for mechanical ventilation and its duration, days of vasopressor need, need for renal replacement therapy, and days of CCU and hospital stay.
2.1. Statistical analysis
All inferential analyses compared either three patient groups (discharged survivors; still-hospitalized or re-hospitalized survivors; non-survivors) or two patient groups, including comparisons of survivors versus non-survivors (discharged or hospitalized) and of a good outcome (discharged survivor) and a poor outcome (still hospitalized or deceased at final follow-up). All continuous variables were tested for normal versus non-normal distribution using the Shapiro-Wilk’s test, with unpaired t-tests and analysis of variance (ANOVA) then used to compare normally-distributed variables, with the Bonferroni test employed post-hoc, and either the non-parametric Mann-Whitney U-test or Kruskal-Wallis test used for two- and three-group comparisons, respectively. For categorical variables, inter-group comparisons were performed using the Pearson χ2 test or Fisher’s Exact test, as appropriate. Correlation analysis of continuous variables (e.g., PSEP level versus SOFA and APACHE II scores) was performed using Pearson’s or Spearman’s correlation coefficients, again depending on variable distribution.
The three patient groups then were compared over time using repeated measure ANOVA (RM-ANOVA) to distinguish levels of all parameters identified on point-in-time bivariable analysis to be significantly different (P < 0.05) over the five data collection points for biomarkers – CCU days 1, 3, 5, 7 and 12. Kaplan-Meier survival curves were generated to follow both patient survival over time and patient survival as a function of PSEP level.
For multivariable analysis, hierarchical logistic regression analysis was performed to identify statistically significant predictors of mortality, using forward entry to enter all variables identified on bivariable analysis to differ at a P ≤ 0.05 between survivors and non-survivors (the one exception being baseline PCT level, which was not statistically different between groups (see Results). Stepwise, demographic and morphometric variables were entered in step 1, baseline laboratory variables in step 2, culture-related variables in step 3, the biomarkers PSEP and PCT in step 4, and treatment variables (e.g., mechanical ventilation, vascular support) in step 5.
Scatter plots then were generated for factors identified as statistically significant predictors of mortality to determine whether specific thresholds might be identified for use in a summation score. For each variable and for each model, areas under the receiver operating curve (AUC-ROC) were calculated for comparison against the literature. Finally, summation score models were generated to evaluate their sensitivity, specificity and accuracy identifying sepsis patients at greater risk of dying, and with greater likelihood of survival.
All analyses were performed using SPSS version 29 with a Bonferroni-adjusted P ≤ 0.001 used as the criterion for statistical significance, to compensate for multiple comparisons on bivariate analysis, but P ≤ 0.05 also noted when considering parameters to compare over time. As stated above, P ≤ 0.05 was used for both variable entry and variable retention in regression models. All analyses were conducted by a PhD-level biostatistician.
A total of 84 patients satisfied eligibility criteria and were enrolled in the study, among whom 51 were male and 33 female and patient age ranged from 18 to 110 years (61.9 ±18.7). Of these, 28 were discharged and still at home at the time of final follow-up, while 12 were either still hospitalized or required re-hospitalization, and 44 died. Length of hospital stay ranged from one day to 314 days. No patient lost to follow-up.
The 44 patients who died over the course of follow-up died from the first day of CCU admission to the 152nd day (Figure 1). Among those 44 deaths, 9 (20.5%) occurred within five days of CCU admission, 13 (29.5%) within ten days, 23 (52.3%) within 20 days, 27 (61.4%) within 28 days, 37 (84.1%) within 60 days, and 42 (95.5%) within 90 days. Corresponding mortality rates across all 84 patients at 5, 10, 20, 28, 60 and 90 days were 10.7%, 15.5%, 27.4%, 32.1%, 44.0%, and 50.0%, respectively. The two patients who died after 90 days died on their 101st and 152nd day post CCU admission.
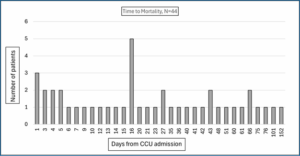
Figure 1: Days to mortality
Table 1 summarizes baseline comparisons between the three patient sub-groups of discharged survivor, hospitalized survivor, and non-survivor in terms of patient demographic, morphometric, and clinical characteristics and CCU day #1 laboratory values. Demographically, non-survivors were significantly older than discharged survivors, by more than 14.5 years, but not significantly different from in-hospital survivors. Day 1 SOFA and APACHE II score and Day 3 SOFA scores also were higher in non-survivors than discharged survivors. Among day #1 laboratories, only PSEP and lactic acid levels, platelet count, and PTT differed between the three groups. For lactic level, the only statistically significant difference was between non-survivors and survivors at home, while PSEP level and PTT were higher in non-survivors than in either other group. Platelet count averaged being lower in non-survivors than in both other groups.
Among treatment variables (Table 2), there was no statistically significant difference between the three outcome groups in any culture-related variable. There was no difference in the number of days on antibiotics, days in the CCU, or days in hospital between non-survivors and survivors at home.
Table 3 summarizes the results of inter-group comparisons of laboratory values across the five serum-sample collection points (days 1, 3, 5, 7, 12). In this table only variables with at least one inter-group difference are summarized, the one exception to this being PCT, which is the comparative variable of particular interest. Platelet levels were statistically lower at all five data-collection points, either relative to both other groups at days 1, 3, 7 and 12, or just versus survivors at home (day 5). Both PSEP and lactic acid levels were statistically highest for the first two blood draws, in all instances significantly greater than levels in at-home survivors. Meanwhile, PTT was higher in non-survivors than at-home survivors on Days 1 and 5 and BUN on days 3 and 7. Prothrombin time only was greatest in non-survivors on CCU day 12. These results are depicted graphically in Figure 2.
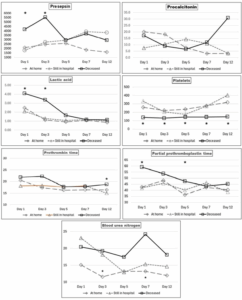
Figure 2: Laboratory values over the five data-collection points
To further assess differences between biomarkers over time, Table 4 summarizes repeated-measures ANOVA (RM-ANOVA) results comparing between the three patient groups, between survivors and non-survivors (deceased), and between patients successfully discharged to home (good outcome) and patients either deceased or still hospitalized, performed using all five measurements, just the first four, just the first three, just the first two, and just baseline measurements. For all parameters except PCT and PT, the early measurements, through the first three to five days, were statistically different between at-home survivors, hospitalized survivors, and non-survivors. This was not true for either PCT or PTT. In addition, PSEP, lactic acid, and platelet count distinguished non-survivors from survivors at all blood samples, while BUN delineated non-survivors only using the two (days 1 and 3) through four (days 1 through 7) measurements. Again, neither PCT nor PT were significantly different between survivors and non-survivors. Performing RM-ANOVA comparing patients successfully discharged home versus the remaining two groups (deceased or still hospitalized), using all five PSEP readings was delineating, while using just the first two PCT readings distinguished good outcome patients. The first two platelet counts, using either three or four BUN readings, and the baseline measurement of PT also delineated good from less good outcomes.
At this point, since a sizeable majority of the detected differences were between survivors and non-survivors, rather than between patients with a good outcome (at-home survival) and poorer outcomes (still hospitalized or deceased), a decision was made to test a model to predict mortality rather than a good outcome on multivariable analysis.
Since entering all five measurement for all seven biomarkers would exceed the power of a multivariable analysis model based upon just 84 patients, a decision was made to average the results of readings, from just two to all five measurements. Table 5 summarizes average readings over the first two blood samples of the same seven variables. There was a statistically significant difference between the outcome groups for PSEP but not PCT, with non-survivor group levels being the highest. The same was true for both lactic acid and PTT, while platelet counts were lowest among non-survivors.
Predictors of mortality
For hierarchical logistic regression analysis, the following variables were entered stepwise: Step 1: patient age and sex; Step 2: day 1 APACHE II and SOFA scores; Step 3: day 3 SOFA score; Step 4: day 1 PSEP (and, in a second model, the average of the day 1 and 3 PSEP levels) and day 1 procalcitonin levels; Step 5: day 1 lactic acid level and platelet count; Step 6: number of vasopressors used and steroid use. Ultimately, only three variables remained in the final model: patient age (P = 0.001), the day 1 PSEP level (P = 0.010), and day 1 SOFA score (P = 0.046). Further models entering the day 3 PSEP level (instead of day 1) and an average of the days 1 and 3 PSEP levels also resulted in the same three parameters being retained. Areas under receiver operating characteristics curves (AUC) were 0.736 when the day 1 PSEP level was used, 0.744 when the day 3 PSEP level used, and 0.745 when the average of the day 1 and day 3 PSEP level was used. This compared to day 1 and 3 AUCs of just 0.457 and 0.423, respectively for PCT. The AUC for the day 1 and 3 SOFA scores were 0.654 and 0.715, respectively, while the AUC for the day 1 APACHE II score was 0.605.
Scatter plots identified the following delineations for age, baseline SOFA score, and mean PSEP level combining the day 1 and day 3 measurements. For age, mortality rates among patients under 40 years of age, from 40-69, and 70-years-old and older were 9.1%, 51.1%, and 74.1%, respectively. For the baseline SOFA score, scores ≤ 6, 7-11, and ≥ 12 were associated with mortality rates of 34.8%, 50.0%, and 72.0%, respectively. For PSEP, levels under 1150, from 1150 to 2499, and ≥2500 were associated with mortality rates of 15.0%, 45.8%, and 71.9%. Generating a composite score combining each patient’s age category, baseline SOFA score, and mean PSEP level over the day 1 and 3 measurements resulted in a scores ranging from 3 to 9, for which scores ≤4 were not linked to any deaths, while the mortality rates for scores from 5-6 and from 7-9 were 28.6% and 73.8%, respectively. Overall, this model was found to be 83.8% sensitive, 71.1% specific, and 77.7% accurate, and have an AUC of 0.800 predicting mortality over the course of follow-up. However, the only factor found during analysis to distinguish between death at 28 versus 90 days follow-up was the serum lactate level on day 3.
As stated earlier, one potential advantage of PSEP over other sepsis biomarkers like CRP and PCT is that it tends to rise earlier in a sepsis patient’s course, especially in patients with more severe infection and septic shock.7-13 In the current study, among the 44 non-survivors, the average PSEP level rose from 4185 on CCU day 1 to 5542 on day 3, while levels for virtually every other biomarker, including PCT, fell. One widely accepted explanation for this rapid elevation is that CD14 is a transmembrane protein present in various cells implicated in sepsis cascades, including the macrophages, monocytes, and granulocytic cells that become activated in response to bacterial infection. During the inflammatory response, the soluble CD14 fragments that are PSEP are cleaved from the monocyte/macrophage-specific CD14 receptor complex after it binds with the lipopolysaccharides (LPS) and LPS binding protein (LPB) present on bacterial walls.19.20 It then rapidly becomes measurable in blood, by chemiluminescent enzyme immunoassay(20]. This contrasts other inflammatory markers, like CRP and PCT, that are released in response to inflammation, rather than infection.21
Over the past 15 years, numerous studies and meta-analyses have found PSEP to significantly predict both bacterial sepsis and sepsis-related mortality.5, 10-17, 20, 22-30 This includes four recently-published meta-analyses and two systematic reviews whose authors found PSEP’s effectiveness as a sepsis biomarker to be at least comparable, and in some studies superior to PCT.5, 10, 17, 24, 29, 30 That said, PCT remains the biomarker that has been most extensively studied in sepsis patients, 3, 4, 6-8, 29, 31-35 and appears especially helpful monitoring the course of therapy, which includes guiding antibiotic cessation.33
How poorly PCT performed in the current study was a surprise. At none of the five data-collection points were PCT levels significantly different between patients who recovered enough to be discharged home, patients who were still hospitalized or had been re-hospitalized, and patients who died. It also immediately dropped out of the regression model predicting mortality. What is consistent with prior reports is that the PCT levels declined steadily among the N=28 patients who recovered enough for home discharge, from 20.1 on day 1 to 18.1, 7.7, 3.2, and 3.2 on days 3 through 12, a trend that was statistically significant (P = 0.003) and consistent with prior studies suggesting a role in therapeutic monitoring and later decision-making. 33
Nonetheless, in our patients, PSEP clearly outperformed PCT, especially over the first 72 hours, where highly significant differences (P = 0.001) were noted between non-survivors and at-home survivors both on bivariable and multivariable analysis. Blood PSEP levels also were strongly correlated with mortality rate, itself explaining 56.6% of the variance (correlation coefficient r=0.752 squared) in that rate. One potential explanation for PSEP outperforming PCT in our sample might be that our patients were more severely ill than in prior studies, which would be consistent with prior research demonstrating superior predictive capacity of PSEP over PCT and other biomarkers in patients with septic shock.11
Ultimately, mean PSEP level over the first 72 hours remained one of only three parameters, besides patient age and the day #1 SOFA score in the final logistic regression model predicting mortality, a model that successfully predicted 71.1% of survivors and 67.6% of non-survivors, for overall accuracy of 69.3%. That age and the SOFA score emerged as significant predictors of mortality is not new, having been reported extensively in previously published studies. 29, 36-42
However, when we subdivided each of these three factors into three levels (e.g., age < 40, 40-69, 70+) and combined to generate a single mortality risk in sepsis summation score ranging from 3 to 9, the model’s sensitivity rose dramatically, from 67.6 to 83.8%, thereby increasing the model’s overall accuracy by almost ten percent, to 77.7%. What this means is that, within 72 hours of CCU admission, this model accurately predicted who would survive and who would not in over 77% of cases.
Interestingly, parameters that did not distinguish between good, fair and poor outcomes included the antibiotic-resistant organisms, which were documented in virtually the same percentage of survivors sent home (28.6%) as in non-survivors (29.5%). The baseline APACHE II score was higher in non-survivors than at-home survivors, but this factor dropped out of the regression model predicting mortality. Similarly, more vasopressors administered and use of steroids in the CCU both were evident in non-survivors than in either at-home or still-hospitalized patients; but again, both factors dropped out of the regression model. Based upon the a summed predictor scale ha bssm devrloped (Figure 3).
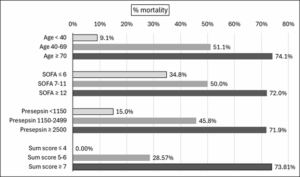
Development of a summed predictor scale
5. Study strengths
We believe that the current study’s main strengths are the measurement of potential sepsis biomarkers over time, the detailed statistical analysis, and being one of the very few studies to have attempted to generate and test an empirically supported composite score to predict mortality in sepsis. There also was no loss to follow-up with every patient followed to either a terminal outcome or a minimum of 90 days.
which may have resulted in clinically significant inter-group differences not being recognized as statistically significant, thereby reducing the number of variables entered into predictive models and restricting us to only entering variables with p-values of 0.05 or less on bivariable testing. Moreover, since five patients died before their 72-hour blood draw, they only had baseline measurements, which prevented any analysis of biomarker sensitivity over time. Similarly, nine patients died before the day #5 blood draw, eleven before day #7 bloodwork, and fourteen before day #12 testing. Additionally, several sepsis biomarkers that might have been tested (e.g., CRP, interleukin 1 and 6 (IL-1, IL-6), and pentraxin-3 – were not evaluated, either because we considered them too sepsis non-specific or because they are not standard care or even available at our hospital. That said, far more research on PCT has been published for any of these other biomarkers(5], so we considered it most suitable for comparison against PSEP. Finally, the more than 52% mortality rate in our sample, including 14 within the first 12 days (16.7% mortality), suggests that our patient sample was sicker than those reported in most other sepsis patient studies. Further research in more representative patient samples is needed.
In a sample of 84 critically-ill sepsis patients followed either until death or to a minimum of 90 days, we identified three variables – patient age, admission SOFA score, and the average of admission and day #3 PSEP levels – that, when combined into a nine-point mortality risk in sepsis summation (MRSS) score, accurately predicted almost 84% of deaths within 72 hours of admission to critical care. Though this work must be considered preliminary, we believe this summation score warrants further testing in larger studies and perhaps less critically ill sepsis patients.
8. Data availability
The datasets used and/or analyzed during the current study are available on reasonable request.
9. Acknowledgements
We thank Dr. Kevin P. White at Science-Right International Health Research (SRIHR) for his contribution in the editing of the manuscript.
10. Ethical considerations
The study protocol was approved by local Ethics Committees at King Abdulaziz university and informed consent were obtained from all participants for their participation and publication of the study result.
11. Conflicts of interest
The authors declared that they have no competing interests.
12. Funding
There was no source of funding for this research.
13. Author's contributions
HA and MA designed the study, contributed to data interpretation, statistical analysis and wrote the manuscript. MA, MA, AA, and SA contributed to data collection, interpretation and revised the manuscript. All authors read and approved the manuscript.
Authors affiliations:
- Haifa M Algethamy, MD. Associate professor, Department of Anesthesia & Critical Care. Faculty of Medicine. King Abdulaziz University. King Abdulaziz University Hospital, Jeddah, Saudi Arabia; Email: halgethamy2020@gmail.com/ halgethami@kau.edu.sa. ORCID {0000-0003-1381-521X}.
- Mohammed M Aboudeif, MD. Department of Anesthesia & Critical Care, King Abdulaziz University Hospital, Jeddah, Saudi Arabia; doctor_abodeif@yahoo.com.
- Mohamed Amin M Ali, MD. Department of Anesthesia & Critical Care, King Abdulaziz University Hospital, Jeddah, Saudi Arabia; dr.mohamedamin3000@gmail.com
- Ahmed M Amin, MD. Department of Anesthesia & Critical Care, King Abdulaziz University Hospital, Jeddah, Saudi Arabia; drahmedamin16@gmail.com
- Shehla N. Amin. Department of Anesthesia & Critical Care, King Abdulaziz University Hospital, Jeddah, Saudi Arabia; shehlanuzhat@hotmail.com
ABSTRACT
Background & Objective: Though numerous biomarkers have been identified with diagnostic and/or prognostic value in sepsis patients; few are sensitive early enough to guide early decision-making. Presepsin (PSEP) appears to spike within the first few days of systemic bacterial infection. We evaluated PSEP’s sensitivity, specificity, accuracy, and area-under-the-curve (AUC) predicting sepsis-related mortality, both used alone and combined with other parameters.
Methodology: A prospective study was conducted of N = 84 adult sepsis patients admitted to critical care units (CCU) at a single, university-affiliated tertiary hospital. All were followed until either death or 90 days after CCU admission, with biomarkers including PSEP and procalcitonin (PCT) measured on days 1, 3, 5, 7 and 12. Bivariable analysis was conducted to identify potential predictors of mortality for use in multivariable analysis and ultimate evaluation of a mortality risk in sepsis summation score.
Results: Among 84 patients, 44 died, 12 remained hospitalized, and 28 were discharged home. At all five blood draws, PSEP levels were significantly higher in sepsis non-survivors than survivors, versus no instances with PCT. Multivariable analysis identified three statistically significant predictors of mortality: patient age, baseline SOFA score, and the average of patients’ day 1 and 3 PSEP levels. From these three variables, all attained within the first 72 hours of CCU admission, a 9-point scale was constructed that was 83.8% sensitive, 71.1% specific, and 77.3% accurate predicting ultimate sepsis-related mortality (AUC = 0.80).
Conclusions: Alone and combined with patient age and baseline SOFA score, early PSEP levels are highly sensitive and specific predicting sepsis-related mortality.
Keywords: Presepsin; Procalcitonin; Predictors; Mortality; Sepsis; SOFA
Citation: Algethamy HM, Aboudeif MM, Ali MAM, Amin AM, Amin SN. Comparing dynamic presepsin and procalcitonin measurements in septic adults: development and testing of a mortality risk in sepsis summation score. Anaesth. pain intensive care 2026;30(2):248-261. DOI: 10.35975/apic.v30i2.3134
Received: August 28, 2025; Revised: December 26, 2025; Accepted: January 01, 2026
1. INTRODUCTION
According to data published by the World Health Organization (WHO), approximately 49 million cases of sepsis and more than 11 million sepsis-related deaths occur worldwide each year, with sepsis accounting for roughly 20% of all deaths.1 In patients with septic shock, mortality rates may exceed 40%.2 Though C-reactive protein (CRP) and procalcitonin (PCT).3-8 are most often used and studied, to date, over 250 different factors have been proposed as potential predictors of systemic sepsis and related outcomes, and this number continues to rise.5,9 This is largely because both CRP and PCT are non-specific, with levels rising in response to aseptic inflammation.5 This said, in a review of almost 5400 references, all published since 2010, among 258 sepsis biomarkers identified, only 40 had been compared against PCT and/or CRP, and only 26 in clinical trials with more than 300 patients.5 Of these, nine were found to outperform CRP and/or PCT, but none of these are widely used and only one (Group II phospholipase A2, PLA2-II) has been examined in a larger study. As such, to date, no ideal single marker or marker combination has emerged to aid in the diagnosis and prognostic stratification of sepsis patients.5, 6, 8-10 One biomarker that has been studied in larger studies and evaluated in meta-analyses as a potential predictor of both sepsis and mortality is presepsin (PSEP), which is what remains after cleavage of the N-terminal of soluble CD14. In numerous studies, PSEP has been found to predict both sepsis and mortality to a degree that is at least comparable to PCT and more specific than CRP.5, 8, 10-17 How PSEP might be advantageous over other sepsis biomarkers – like PCT, CRP, interleukin-1 (IL-1) and IL-6 – is that levels appear to spike earlier in the course of systematic sepsis and, as such, might be better at guiding early therapy.14
In this study, we measured levels of PSEP, PCT, and several other biomarkers at five time-points over the first 12 days after patients had been hospitalized for sepsis. Specific objectives were to: (a) determine whether PSEP actually does spike earlier than the other biomarkers; (b) determine whether multiple levels enhance its diagnostic and prognostic sensitivity and specificity; (c) compare its overall accuracy to PCT over five measurements spanning 12 days; and (d) develop and evaluate the sensitivity, specificity, accuracy, and area under the receiver operating characteristic curve (AUC) of a composite score of statistically-significant predictors of sepsis-related mortality.
2. METHODOLOGY
The study was conducted in all critical care units at King Abdulaziz University Hospital in the city of Jeddah. All patients of age 18 years or older with either sepsis or septic shock admitted to a critical care unit within 24 hours of their sepsis being recognized using Sepsis-3 criteria.2 were considered for enrollment, provided either they or their next-of-kin provided informed written consent. Exclusion criteria were age less than 18 years; CCU admission more than 24 hours after recognition of their sepsis or septic shock; known or suspected pregnancy, negative culture result from the primary site of infection; lack of signed informed consent.
At the time of admission, all patients underwent a complete history and physical examination, a set list of baseline laboratories that included blood levels of PSEP, PCT, lactic acid, blood cell counts (red blood cells, leukocytes, lymphocytes, platelets), serum electrolytes, blood urea nitrogen (BUN) and creatinine, alanine transaminase (ALT), aspartate transaminase (AST), bilirubin, prothrombin time (PT), partial thromboplastin time (PTT), and international normalized ratio (INR). In addition, baseline scores for both the APACHE II and SOFA scales were calculated, both at the time of admission and 72 hours later. All the above-listed laboratory investigations were repeated on the third, fifth, seventh, and twelfth day after CCU admission. Both PSEP (sCD14-ST) and PCT values were measured using an immunoassay analyzer.
Two or more blood samples of 5-10 mL were collected cultures were collected from each patient on admission. Bacteremia was defined as recovery of any pathogenic bacterial species in one or two sets of blood cultures. Microorganisms commonly considered as contaminants were excluded from the bacteremia group.18 Cultures from any known or suspected site or source of infection also were collected, including sputum, urine, wound, and any device or inserted catheter, as clinically indicated, BUN, creatinine, AST, ALT, PT, INR, PTT, bilirubin (Total and Direct), random blood sugar, and serum sodium and potassium levels.
Patient management was at the discretion of the medical team, led by the attending CCU physician and aided, as needed, by attending infectious disease consultants, following 2016 Sepsis-3 guidelines.2
Every patient was followed until either death, hospital discharge, or the end of 90 days follow-up, whichever was longest in duration. The primary outcome of interest was clinical status 28 and 90 days after CCU admission and at final follow-up (if greater than 90 days). Primary outcomes were categorized as survival with discharge home; survival but either still or re-hospitalized; and mortality. Over the course of follow-up, the following additional clinical parameters were recorded; all released cultures, time of starting and stopping antibiotics, need for mechanical ventilation and its duration, days of vasopressor need, need for renal replacement therapy, and days of CCU and hospital stay.
2.1. Statistical analysis
All inferential analyses compared either three patient groups (discharged survivors; still-hospitalized or re-hospitalized survivors; non-survivors) or two patient groups, including comparisons of survivors versus non-survivors (discharged or hospitalized) and of a good outcome (discharged survivor) and a poor outcome (still hospitalized or deceased at final follow-up). All continuous variables were tested for normal versus non-normal distribution using the Shapiro-Wilk’s test, with unpaired t-tests and analysis of variance (ANOVA) then used to compare normally-distributed variables, with the Bonferroni test employed post-hoc, and either the non-parametric Mann-Whitney U-test or Kruskal-Wallis test used for two- and three-group comparisons, respectively. For categorical variables, inter-group comparisons were performed using the Pearson χ2 test or Fisher’s Exact test, as appropriate. Correlation analysis of continuous variables (e.g., PSEP level versus SOFA and APACHE II scores) was performed using Pearson’s or Spearman’s correlation coefficients, again depending on variable distribution.
The three patient groups then were compared over time using repeated measure ANOVA (RM-ANOVA) to distinguish levels of all parameters identified on point-in-time bivariable analysis to be significantly different (P < 0.05) over the five data collection points for biomarkers – CCU days 1, 3, 5, 7 and 12. Kaplan-Meier survival curves were generated to follow both patient survival over time and patient survival as a function of PSEP level.
For multivariable analysis, hierarchical logistic regression analysis was performed to identify statistically significant predictors of mortality, using forward entry to enter all variables identified on bivariable analysis to differ at a P ≤ 0.05 between survivors and non-survivors (the one exception being baseline PCT level, which was not statistically different between groups (see Results). Stepwise, demographic and morphometric variables were entered in step 1, baseline laboratory variables in step 2, culture-related variables in step 3, the biomarkers PSEP and PCT in step 4, and treatment variables (e.g., mechanical ventilation, vascular support) in step 5.
Scatter plots then were generated for factors identified as statistically significant predictors of mortality to determine whether specific thresholds might be identified for use in a summation score. For each variable and for each model, areas under the receiver operating curve (AUC-ROC) were calculated for comparison against the literature. Finally, summation score models were generated to evaluate their sensitivity, specificity and accuracy identifying sepsis patients at greater risk of dying, and with greater likelihood of survival.
All analyses were performed using SPSS version 29 with a Bonferroni-adjusted P ≤ 0.001 used as the criterion for statistical significance, to compensate for multiple comparisons on bivariate analysis, but P ≤ 0.05 also noted when considering parameters to compare over time. As stated above, P ≤ 0.05 was used for both variable entry and variable retention in regression models. All analyses were conducted by a PhD-level biostatistician.
3. RESULTS
A total of 84 patients satisfied eligibility criteria and were enrolled in the study, among whom 51 were male and 33 female and patient age ranged from 18 to 110 years (61.9 ±18.7). Of these, 28 were discharged and still at home at the time of final follow-up, while 12 were either still hospitalized or required re-hospitalization, and 44 died. Length of hospital stay ranged from one day to 314 days. No patient lost to follow-up.
The 44 patients who died over the course of follow-up died from the first day of CCU admission to the 152nd day (Figure 1). Among those 44 deaths, 9 (20.5%) occurred within five days of CCU admission, 13 (29.5%) within ten days, 23 (52.3%) within 20 days, 27 (61.4%) within 28 days, 37 (84.1%) within 60 days, and 42 (95.5%) within 90 days. Corresponding mortality rates across all 84 patients at 5, 10, 20, 28, 60 and 90 days were 10.7%, 15.5%, 27.4%, 32.1%, 44.0%, and 50.0%, respectively. The two patients who died after 90 days died on their 101st and 152nd day post CCU admission.
Figure 1: Days to mortality
Table 1 summarizes baseline comparisons between the three patient sub-groups of discharged survivor, hospitalized survivor, and non-survivor in terms of patient demographic, morphometric, and clinical characteristics and CCU day #1 laboratory values. Demographically, non-survivors were significantly older than discharged survivors, by more than 14.5 years, but not significantly different from in-hospital survivors. Day 1 SOFA and APACHE II score and Day 3 SOFA scores also were higher in non-survivors than discharged survivors. Among day #1 laboratories, only PSEP and lactic acid levels, platelet count, and PTT differed between the three groups. For lactic level, the only statistically significant difference was between non-survivors and survivors at home, while PSEP level and PTT were higher in non-survivors than in either other group. Platelet count averaged being lower in non-survivors than in both other groups.
| Table 1: Comparative baseline patient characteristics and laboratories | ||||
| Variable
Final outcome |
At home
(n = 28) |
Still in hospital
(n = 12) |
Deceased
(n = 44) |
P-value
|
| Patient characteristics | ||||
| Percentage male, N=51 | 39.2% | 17.6% | 43.1% | 0.11 |
| Percentage female, N=33 | 24.2% | 9.1% | 66.7% | |
| Mean age (years) | 53.04 | 59.75 | 67.89 | 0.004 |
| Body Mass Index (kg/m2) | 26.14 | 28.45 | 26.29 | 0.57 |
| Day 1 APACHE score | 19.79 | 24.17 | 24.95 | 0.047 |
| Day 1 SOFA score | 7.54 | 10.17 | 10.41 | 0.007 |
| Day 3 SOFA score | 5.33 | 7.58 | 9.26 | < 0.001 |
| DM: | 35.0 % | 15.0 % | 50.0 % | 0.92 |
| HTN: | 25.5 % | 17.0 % | 57.4 % | 0.28 |
| CVD: | 36.1 % | 11.1 % | 52.8 % | 0.74 |
| Chronic lung disease: | 35.7 % | 14.3 % | 50.0 % | 0.98 |
| CKD: | 28.6 % | 9.5 % | 61.9 % | 0.57 |
| Chronic liver disease: | 0 % | 0 % | 100 % | 0.24 |
| Cancer: | 26.3 % | 10.5 % | 63.2 % | 0.60 |
| Other comorbid conditions: | 34.0 % | 11.3 % | 54.7 % | 0.59 |
| Mean number of comorbid conditions |
2.50 | 2.50 | 2.95 | 0.40 |
| Baseline laboratories | ||||
| Presepsin (pg/mL) | 2114.0 | 1801.4 | 4184.8 | 0.001 |
| Procalcitonin (ng/mL) | 20.1 | 7.5 | 17.1 | 0.56 |
| Lactic acid level (mmol/L) | 2.5 | 2.1 | 4.1 | 0.026 |
| Leukocytes (x 103 cells/mm3) | 16.2 | 12.6 | 13.6 | 0.87 |
| Lymphocytes (109/L.) | 1.8 | 0.9 | 1.2 | 0.77 |
| Platelets (x 1000 cells/mm3) | 259.3 | 331.6 | 139.4 | < 0.001 |
| BUN (mg/dL) | 15.1 | 23.1 | 20.4 | 0.17 |
| Creatinine | 206.5 | 229.3 | 259.0 | 0.29 |
| ALT (units/L) | 37.4 | 21.8 | 83.8 | 0.29 |
| AST (units/L) | 54.5 | 64.3 | 125.2 | 0.60 |
| Albumin (g/dL) | 35.1 | 36.2 | 34.9 | 0.89 |
| Prothrombin time (sec) | 20.5 | 18.2 | 21.9 | 0.96 |
| Partial thromboplastin time (sec) |
42.7 | 42.0 | 59.2 | 0.024 |
| INR | 1.5 | 1.4 | 1.8 | 0.70 |
| DM, diabetes mellitus; HTN, hypertension; CVD, cardiovascular disease; CKD, chronic kidney disease; BUN, blood urea nitrogen; ALT, alanine transferase; ASP, aspartate transferase, INR, international normalized ratio; P < 0.05 considered as significant | ||||
Among treatment variables (Table 2), there was no statistically significant difference between the three outcome groups in any culture-related variable. There was no difference in the number of days on antibiotics, days in the CCU, or days in hospital between non-survivors and survivors at home.
| Table 2: Comparing culture status results and medical support required | ||||
| Variable
Final outcome |
At home
(n = 28) |
Still in hospital
(n = 12) |
Deceased
(n = 44) |
P-value
|
| Culture results and antibiotic therapy | ||||
| Number of positive cultures | 1.28 | 1.58 | 1.78 | 0.46 |
| Positive blood culture | 25.0% | 41.7% | 38.6% | 0.42 |
| Positive airway culture | 23.1% | 33.3% | 43.6% | 0.24 |
| Positive urine culture | 17.9% | 25.0% | 11.9% | 0.63 |
| Positive wound culture | 11.1% | 11.1% | 18.5% | 0.23 |
| Positive other fluid culture | 20.0% | 0.0% | 24.0% | 0.29 |
| Positive device culture | 6.3% | 25.0% | 23.8% | 0.32 |
| Gram negative organism | 39.5% | 7.9% | 52.6% | 0.360 |
| Gram positive organism | 14.3% | 21.4% | 64.3% | |
| Both | 33.3% | 0.0% | 66.7% | |
| Resistant organism | 28.6% | 0.0% | 29.5% | 0.18 |
| Days on antibiotics | 11.39 | 36.42 | 12.80 | < 0.001 |
| Other interventions | ||||
| Mechanical ventilation | 82.1% | 91.7% | 90.9% | 0.49 |
| Vasopressor support used | 78,6% | 83.3% | 93,2% | 0.19 |
| Number of vasopressors | 1.18 | 0.83 | 1.43 | 0.041 |
| Renal replacement therapy | 17.9% | 25.0% | 36.4% | 0.23 |
| Steroids administered | 46.4% | 41.7% | 86.0% | < 0.001 |
| Days in the critical care unit | 11.1 | 23.6 | 11.7 | 0.017 |
| Days in the hospital | 39.6 | 106.2 | 30.6 | < 0.001 |
| P < 0.05 considered as significant | ||||
Table 3 summarizes the results of inter-group comparisons of laboratory values across the five serum-sample collection points (days 1, 3, 5, 7, 12). In this table only variables with at least one inter-group difference are summarized, the one exception to this being PCT, which is the comparative variable of particular interest. Platelet levels were statistically lower at all five data-collection points, either relative to both other groups at days 1, 3, 7 and 12, or just versus survivors at home (day 5). Both PSEP and lactic acid levels were statistically highest for the first two blood draws, in all instances significantly greater than levels in at-home survivors. Meanwhile, PTT was higher in non-survivors than at-home survivors on Days 1 and 5 and BUN on days 3 and 7. Prothrombin time only was greatest in non-survivors on CCU day 12. These results are depicted graphically in Figure 2.
| Table 3: Comparative laboratory parameters with good, intermediate, and poor outcomes over time | ||||
| Variable
Final outcome |
At home
(n = 28) |
Still in hospital
(n = 12) |
Deceased
(n = 44) |
P-value
|
| Presepsin - Day 1 | 2114.0 | 1801.4 | 4184.8 | 0.001 |
| Presepsin - Day 3 | 2460.6 | 2731.4 | 5541.9 | 0.001 |
| Presepsin - Day 5 | 2583.6 | 2938.8 | 2938.8 | 0.13 |
| Presepsin - Day 7 | 1857.8 | 3930.8 | 3690.9 | 0.054 |
| Presepsin - Day 12 | 1606.0 | 3820.7 | 2943.4 | 0.06 |
| Average presepsin level | 2124.4 | 3044.6 | 3860.0 | 3165.0 |
| Procalcitonin - Day 1 | 20.1 | 7.5 | 17.1 | 0.56 |
| Procalcitonin - Day 3 | 18.1 | 10.6 | 9.0 | 0.41 |
| Procalcitonin - Day 5 | 7.7 | 14.4 | 6.5 | 0.90 |
| Procalcitonin - Day 7 | 3.2 | 10.9 | 11.9 | 0.72 |
| Procalcitonin - Day 12 | 3.2 | 3.4 | 31.0 | 0.12 |
| Average procalcitonin level | 10.5 | 9.4 | 15.1 | 12.8 |
| Lactic acid - Day 1 | 2.49 | 2.10 | 4.09 | 0.026 |
| Lactic acid - Day 3 | 1.14 | 1.30 | 3.38 | 0.014 |
| Lactic acid - Day 5 | 0.92 | 1.08 | 1.65 | 0.10 |
| Lactic acid - Day 7 | 1.09 | 1.18 | 1.17 | 0.94 |
| Lactic acid - Day 12 | 0.86 | 1.05 | 1.15 | 0.44 |
| Average lactic acid level | 1.3 | 1.3 | 2.3 | 1.8 |
| Platelets - Day 1 | 259.3 | 331.6 | 139.4 | < 0.001 |
| Platelets - Day 3 | 222.2 | 205.4 | 130.2 | 0.004 |
| Platelets - Day 5 | 235.4 | 176.3 | 143.6 | 0.029 |
| Platelets - Day 7 | 277.4 | 273.3 | 144.0 | 0.005 |
| Platelets - Day 12 | 318.2 | 403.7 | 146.9 | 0.006 |
| Average platelet count | 262.5 | 278.1 | 140.8 | 201.0 |
| BUN - Day 1 | 15.11 | 23.07 | 20.42 | 0.17 |
| BUN - Day 3 | 11.58 | 18.15 | 19.22 | 0.010 |
| BUN - Day 5 | 13.20 | 12.93 | 17.44 | 0.20 |
| BUN - Day 7 | 13.18 | 15.33 | 24.21 | 0.010 |
| BUN - Day 12 | 11.98 | 14.62 | 18.10 | 0.11 |
| Average BUN | 13.0 | 16.8 | 19.9 | 17.2 |
| PT - Day 1 | 20.51 | 18.17 | 21.90 | 0.96 |
| PT - Day 3 | 17.39 | 18.34 | 22.28 | 0.15 |
| PT - Day 5 | 16.34 | 17.70 | 17.83 | 0.21 |
| PT - Day 7 | 16.48 | 18.18 | 17.90 | 0.16 |
| PT - Day 12 | 16.46 | 15.05 | 18.81 | 0.041 |
| Average PT | 17.4 | 17.5 | 19.7 | 18.6 |
| PTT - Day 1 | 42.7 | 42.0 | 59.2 | 0.044 |
| PTT - Day 3 | 48.1 | 45.8 | 53.7 | 0.43 |
| PTT - Day 5 | 36.3 | 40.3 | 47.5 | 0.021 |
| PTT - Day 7 | 42.4 | 46.2 | 43.4 | 0.69 |
| PTT - Day 12 | 40.4 | 38.6 | 45.3 | 0.36 |
| Average PTT | 42.0 | 42.6 | 49.8 | 46.2 |
| All averages weighted for the number of patients in each group | ||||
Figure 2: Laboratory values over the five data-collection points
To further assess differences between biomarkers over time, Table 4 summarizes repeated-measures ANOVA (RM-ANOVA) results comparing between the three patient groups, between survivors and non-survivors (deceased), and between patients successfully discharged to home (good outcome) and patients either deceased or still hospitalized, performed using all five measurements, just the first four, just the first three, just the first two, and just baseline measurements. For all parameters except PCT and PT, the early measurements, through the first three to five days, were statistically different between at-home survivors, hospitalized survivors, and non-survivors. This was not true for either PCT or PTT. In addition, PSEP, lactic acid, and platelet count distinguished non-survivors from survivors at all blood samples, while BUN delineated non-survivors only using the two (days 1 and 3) through four (days 1 through 7) measurements. Again, neither PCT nor PT were significantly different between survivors and non-survivors. Performing RM-ANOVA comparing patients successfully discharged home versus the remaining two groups (deceased or still hospitalized), using all five PSEP readings was delineating, while using just the first two PCT readings distinguished good outcome patients. The first two platelet counts, using either three or four BUN readings, and the baseline measurement of PT also delineated good from less good outcomes.
| Table 4: Repeated-measures ANOVA for all five readings through just the initial (baseline) data-collection value f N=84 sepsis patients | ||||
| Number of readings collected over days 1, 3, 5, 7 and 12 | Overall outcome (home vs. still hospitalized vs. deceased) | Deceased | Good outcome (discharged home) | |
| Presepsin (PSEP) | 5 readings (days 1, 3, 5, 7, 12) | 0.08 | 0.030 | 0.050 |
| 4 readings (days 1, 3, 5, 7) | 0.08 | 0.022 | 0.10 | |
| 3 readings (days 1, 3, 5) | 0.053 | 0.017 | 0.16 | |
| 2 readings (days 1, 3) | 0.015 | 0.004 | 0.07 | |
| Day #1 only | 0.022 | 0.016 | 0.08 | |
| Procalcitonin (PCT) | 5 readings (days 1, 3, 5, 7, 12) | 0.47 | 0.30 | 0.84 |
| 4 readings (days 1, 3, 5, 7) | 0.54 | 0.81 | 0.35 | |
| 3 readings (days 1, 3, 5) | 0.23 | 0.31 | 0.09 | |
| 2 readings (days 1, 3) | 0.11 | 0.25 | 0.042 | |
| Day #1 only | 0.40 | 0.96 | 0.41 | |
| Lactic acid | 5 readings (days 1, 3, 5, 7, 12) | 0.12 | 0.040 | 0.27 |
| 4 readings (days 1, 3, 5, 7) | 0.11 | 0.037 | 0.15 | |
| 3 readings (days 1, 3, 5) | 0.033 | 0.009 | 0.08 | |
| 2 readings (days 1, 3) | 0.035 | 0.009 | 0.07 | |
| Day #1 only | 0.046 | 0.014 | 0.12 | |
| Platelets | 5 readings (days 1, 3, 5, 7, 12) | 0.08 | 0.030 | 0.27 |
| 4 readings (days 1, 3, 5, 7) | 0.13 | 0.044 | 0.18 | |
| 3 readings (days 1, 3, 5) | 0.027 | 0 008 | 0.07 | |
| 2 readings (days 1, 3) | 0.001 | P < 0.001 | 0.016 | |
| Day #1 only | P < 0.001 | P < 0.001 | 0.013 | |
| Blood urea nitrogen (BUN) | 5 readings (days 1, 3, 5, 7, 12) | 0.085 | 0.031 | 0.28 |
| 4 readings (days 1, 3, 5, 7) | 0.30 | 0.003 | 0.036 | |
| 3 readings (days 1, 3, 5) | 0.09 | 0.007 | 0.032 | |
| 2 readings (days 1, 3) | 0.030 | 0.026 | 0.07 | |
| Day #1 only | 0.17 | 0.33 | 0.11 | |
| Prothrombin time (PT) | 5 readings (days 1, 3, 5, 7, 12) | 0.30 | 0.15 | 0.47 |
| 4 readings (days 1, 3, 5, 7) | 0.48 | 0.25 | 0.45 | |
| 3 readings (days 1, 3, 5) | 0.68 | 0.46 | 0.71 | |
| 2 readings (days 1, 3) | 0.14 | 0.25 | 0.06 | |
| Day #1 only | 0.96 | 0.50 | 0.69 | |
| Partial thromboplastin time (PTT) | 5 readings (days 1, 3, 5, 7, 12) | 0.09 | 0.027 | 0.20 |
| 4 readings (days 1, 3, 5, 7) | 0.30 | 0.12 | 0.30 | |
| 3 readings (days 1, 3, 5) | 0.09 | 0.031 | 0.15 | |
| 2 readings (days 1, 3) | 0.030 | 0.009 | 0.09 | |
| Day #1 only | 0.044 | 0.012 | 0.047 | |
At this point, since a sizeable majority of the detected differences were between survivors and non-survivors, rather than between patients with a good outcome (at-home survival) and poorer outcomes (still hospitalized or deceased), a decision was made to test a model to predict mortality rather than a good outcome on multivariable analysis.
Since entering all five measurement for all seven biomarkers would exceed the power of a multivariable analysis model based upon just 84 patients, a decision was made to average the results of readings, from just two to all five measurements. Table 5 summarizes average readings over the first two blood samples of the same seven variables. There was a statistically significant difference between the outcome groups for PSEP but not PCT, with non-survivor group levels being the highest. The same was true for both lactic acid and PTT, while platelet counts were lowest among non-survivors.
| Table 5: Average readings over the first 72 hours in the critical care unit (CCU) | ||||
| Test | At home
(n = 28) |
Still in hospital
(n = 12) |
Deceased
(n = 44) |
P-value
|
| Presepsin | 2287.1 | 1754.0 | 4505.5 | 0.015 |
| Procalcitonin | 17.38 | 5.76 | 9.50 | 0.11 |
| Lactic acid | 1.80 | 1.70 | 3.56 | 0.035 |
| Platelet count | 240.8 | 315.8 | 124.8 | 0.001 |
| BUN | 13.40 | 12.97 | 19.82 | 0.087 |
| PT | 19.83 | 17.18 | 22.41 | 0.47 |
| PTT | 46,24 | 41.58 | 51.83 | 0.030 |
| BUN, blood urea nitrogen; PT, prothrombin time; PTT, partial thromboplastin time;
P 0.05 considered as significant |
||||
Predictors of mortality
For hierarchical logistic regression analysis, the following variables were entered stepwise: Step 1: patient age and sex; Step 2: day 1 APACHE II and SOFA scores; Step 3: day 3 SOFA score; Step 4: day 1 PSEP (and, in a second model, the average of the day 1 and 3 PSEP levels) and day 1 procalcitonin levels; Step 5: day 1 lactic acid level and platelet count; Step 6: number of vasopressors used and steroid use. Ultimately, only three variables remained in the final model: patient age (P = 0.001), the day 1 PSEP level (P = 0.010), and day 1 SOFA score (P = 0.046). Further models entering the day 3 PSEP level (instead of day 1) and an average of the days 1 and 3 PSEP levels also resulted in the same three parameters being retained. Areas under receiver operating characteristics curves (AUC) were 0.736 when the day 1 PSEP level was used, 0.744 when the day 3 PSEP level used, and 0.745 when the average of the day 1 and day 3 PSEP level was used. This compared to day 1 and 3 AUCs of just 0.457 and 0.423, respectively for PCT. The AUC for the day 1 and 3 SOFA scores were 0.654 and 0.715, respectively, while the AUC for the day 1 APACHE II score was 0.605.
Scatter plots identified the following delineations for age, baseline SOFA score, and mean PSEP level combining the day 1 and day 3 measurements. For age, mortality rates among patients under 40 years of age, from 40-69, and 70-years-old and older were 9.1%, 51.1%, and 74.1%, respectively. For the baseline SOFA score, scores ≤ 6, 7-11, and ≥ 12 were associated with mortality rates of 34.8%, 50.0%, and 72.0%, respectively. For PSEP, levels under 1150, from 1150 to 2499, and ≥2500 were associated with mortality rates of 15.0%, 45.8%, and 71.9%. Generating a composite score combining each patient’s age category, baseline SOFA score, and mean PSEP level over the day 1 and 3 measurements resulted in a scores ranging from 3 to 9, for which scores ≤4 were not linked to any deaths, while the mortality rates for scores from 5-6 and from 7-9 were 28.6% and 73.8%, respectively. Overall, this model was found to be 83.8% sensitive, 71.1% specific, and 77.7% accurate, and have an AUC of 0.800 predicting mortality over the course of follow-up. However, the only factor found during analysis to distinguish between death at 28 versus 90 days follow-up was the serum lactate level on day 3.
4. DISCUSSION
As stated earlier, one potential advantage of PSEP over other sepsis biomarkers like CRP and PCT is that it tends to rise earlier in a sepsis patient’s course, especially in patients with more severe infection and septic shock.7-13 In the current study, among the 44 non-survivors, the average PSEP level rose from 4185 on CCU day 1 to 5542 on day 3, while levels for virtually every other biomarker, including PCT, fell. One widely accepted explanation for this rapid elevation is that CD14 is a transmembrane protein present in various cells implicated in sepsis cascades, including the macrophages, monocytes, and granulocytic cells that become activated in response to bacterial infection. During the inflammatory response, the soluble CD14 fragments that are PSEP are cleaved from the monocyte/macrophage-specific CD14 receptor complex after it binds with the lipopolysaccharides (LPS) and LPS binding protein (LPB) present on bacterial walls.19.20 It then rapidly becomes measurable in blood, by chemiluminescent enzyme immunoassay(20]. This contrasts other inflammatory markers, like CRP and PCT, that are released in response to inflammation, rather than infection.21
Over the past 15 years, numerous studies and meta-analyses have found PSEP to significantly predict both bacterial sepsis and sepsis-related mortality.5, 10-17, 20, 22-30 This includes four recently-published meta-analyses and two systematic reviews whose authors found PSEP’s effectiveness as a sepsis biomarker to be at least comparable, and in some studies superior to PCT.5, 10, 17, 24, 29, 30 That said, PCT remains the biomarker that has been most extensively studied in sepsis patients, 3, 4, 6-8, 29, 31-35 and appears especially helpful monitoring the course of therapy, which includes guiding antibiotic cessation.33
How poorly PCT performed in the current study was a surprise. At none of the five data-collection points were PCT levels significantly different between patients who recovered enough to be discharged home, patients who were still hospitalized or had been re-hospitalized, and patients who died. It also immediately dropped out of the regression model predicting mortality. What is consistent with prior reports is that the PCT levels declined steadily among the N=28 patients who recovered enough for home discharge, from 20.1 on day 1 to 18.1, 7.7, 3.2, and 3.2 on days 3 through 12, a trend that was statistically significant (P = 0.003) and consistent with prior studies suggesting a role in therapeutic monitoring and later decision-making. 33
Nonetheless, in our patients, PSEP clearly outperformed PCT, especially over the first 72 hours, where highly significant differences (P = 0.001) were noted between non-survivors and at-home survivors both on bivariable and multivariable analysis. Blood PSEP levels also were strongly correlated with mortality rate, itself explaining 56.6% of the variance (correlation coefficient r=0.752 squared) in that rate. One potential explanation for PSEP outperforming PCT in our sample might be that our patients were more severely ill than in prior studies, which would be consistent with prior research demonstrating superior predictive capacity of PSEP over PCT and other biomarkers in patients with septic shock.11
Ultimately, mean PSEP level over the first 72 hours remained one of only three parameters, besides patient age and the day #1 SOFA score in the final logistic regression model predicting mortality, a model that successfully predicted 71.1% of survivors and 67.6% of non-survivors, for overall accuracy of 69.3%. That age and the SOFA score emerged as significant predictors of mortality is not new, having been reported extensively in previously published studies. 29, 36-42
However, when we subdivided each of these three factors into three levels (e.g., age < 40, 40-69, 70+) and combined to generate a single mortality risk in sepsis summation score ranging from 3 to 9, the model’s sensitivity rose dramatically, from 67.6 to 83.8%, thereby increasing the model’s overall accuracy by almost ten percent, to 77.7%. What this means is that, within 72 hours of CCU admission, this model accurately predicted who would survive and who would not in over 77% of cases.
Interestingly, parameters that did not distinguish between good, fair and poor outcomes included the antibiotic-resistant organisms, which were documented in virtually the same percentage of survivors sent home (28.6%) as in non-survivors (29.5%). The baseline APACHE II score was higher in non-survivors than at-home survivors, but this factor dropped out of the regression model predicting mortality. Similarly, more vasopressors administered and use of steroids in the CCU both were evident in non-survivors than in either at-home or still-hospitalized patients; but again, both factors dropped out of the regression model. Based upon the a summed predictor scale ha bssm devrloped (Figure 3).
Development of a summed predictor scale
5. Study strengths
We believe that the current study’s main strengths are the measurement of potential sepsis biomarkers over time, the detailed statistical analysis, and being one of the very few studies to have attempted to generate and test an empirically supported composite score to predict mortality in sepsis. There also was no loss to follow-up with every patient followed to either a terminal outcome or a minimum of 90 days.
6. LIMITATIONS
which may have resulted in clinically significant inter-group differences not being recognized as statistically significant, thereby reducing the number of variables entered into predictive models and restricting us to only entering variables with p-values of 0.05 or less on bivariable testing. Moreover, since five patients died before their 72-hour blood draw, they only had baseline measurements, which prevented any analysis of biomarker sensitivity over time. Similarly, nine patients died before the day #5 blood draw, eleven before day #7 bloodwork, and fourteen before day #12 testing. Additionally, several sepsis biomarkers that might have been tested (e.g., CRP, interleukin 1 and 6 (IL-1, IL-6), and pentraxin-3 – were not evaluated, either because we considered them too sepsis non-specific or because they are not standard care or even available at our hospital. That said, far more research on PCT has been published for any of these other biomarkers(5], so we considered it most suitable for comparison against PSEP. Finally, the more than 52% mortality rate in our sample, including 14 within the first 12 days (16.7% mortality), suggests that our patient sample was sicker than those reported in most other sepsis patient studies. Further research in more representative patient samples is needed.
7. CONCLUSIONS
In a sample of 84 critically-ill sepsis patients followed either until death or to a minimum of 90 days, we identified three variables – patient age, admission SOFA score, and the average of admission and day #3 PSEP levels – that, when combined into a nine-point mortality risk in sepsis summation (MRSS) score, accurately predicted almost 84% of deaths within 72 hours of admission to critical care. Though this work must be considered preliminary, we believe this summation score warrants further testing in larger studies and perhaps less critically ill sepsis patients.
8. Data availability
The datasets used and/or analyzed during the current study are available on reasonable request.
9. Acknowledgements
We thank Dr. Kevin P. White at Science-Right International Health Research (SRIHR) for his contribution in the editing of the manuscript.
10. Ethical considerations
The study protocol was approved by local Ethics Committees at King Abdulaziz university and informed consent were obtained from all participants for their participation and publication of the study result.
11. Conflicts of interest
The authors declared that they have no competing interests.
12. Funding
There was no source of funding for this research.
13. Author's contributions
HA and MA designed the study, contributed to data interpretation, statistical analysis and wrote the manuscript. MA, MA, AA, and SA contributed to data collection, interpretation and revised the manuscript. All authors read and approved the manuscript.
14. REFERENCES
- La Via L, Sangiorgio G, Stefani S, Marino A, Nunnari G, Cocuzza S, La Mantia I, Cacopardo B, Stracquadanio S, Spampinato S et al. The Global Burden of Sepsis and Septic Shock. Epidemiologia (Basel) 2024, 5(3):456-478. PMCID: PMC11348270. DOI: 10.3390/epidemiologia5030032.
- Singer M, Deutschman CS, Seymour CW, Shankar-Hari M, Annane D, Bauer M, Bellomo R, Bernard GR, Chiche JD, Coopersmith CM et al. The Third International Consensus Definitions for Sepsis and Septic Shock (Sepsis-3). Jama 2016, 315(8):801-810. PMCID: PMC4968574 DOI: 10.1001/jama.2016.0287.
- Gregoriano C, Heilmann E, Molitor A, Schuetz P. Role of procalcitonin use in the management of sepsis. J Thorac Dis 2020, 12(Suppl 1):S5-s15. PMCID: PMC7024752. DOI: 10.21037/jtd.2019.11.63.
- Herrmann W, Ecker D, Quast S, Klieden M, Rose S, Marzi I. Comparison of procalcitonin, sCD14 and interleukin-6 values in septic patients. Clin Chem Lab Med 2000, 38(1):41-46. PMID: 10774960. DOI: 10.1515/CCLM.2000.007.
- Pierrakos C, Velissaris D, Bisdorff M, Marshall JC, Vincent JL. Biomarkers of sepsis: time for a reappraisal. Crit Care 2020, 24(1):287. PMID: 32503670 PMCID: PMC7273821. DOI: 10.1186/s13054-020-02993-5
- Riedel S. Procalcitonin and the role of biomarkers in the diagnosis and management of sepsis. Diagn Microbiol Infect Dis 2012, 73(3):221-227. PMID: 22704255. DOI: 10.1016/j.diagmicrobio.2012.05.002
- Rowland T, Hilliard H, Barlow G. Procalcitonin: potential role in diagnosis and management of sepsis. Adv Clin Chem 2015, 68:71-86.PMID: 25858869.DOI: 10.1016/bs.acc.2014.11.005
- Sinha A, Sankanagoudar S, Sharma A, Kothari N, Gupta N, Sharma P. Recent Scenario of Diagnostic and Prognostic Biomarkers of Sepsis in Clinical Practice and the Role of Multi-marker Approach: An Update. Ann Afr Med 2025.PMID: 40177821 PMCID: PMC12380167. DOI: 10.4103/aam.aam_50_24
- Pierrakos C, Vincent JL. Sepsis biomarkers: a review. Crit Care 2010, 14(1):R15. PMID: 20144219 PMCID: PMC2875530. DOI: 10.1186/cc8872
- Velissaris D, Zareifopoulos N, Karamouzos V, Karanikolas E, Pierrakos C, Koniari I, Karanikolas M. Presepsin as a Diagnostic and Prognostic Biomarker in Sepsis. Cureus 2021, 13(5):e15019. PMID: 34150378 PMCID: PMC8202808. DOI: 10.7759/cureus.15019
- Aliu-Bejta A, Atelj A, Kurshumliu M, Dreshaj S, Baršić B. Presepsin values as markers of severity of sepsis. Int J Infect Dis 2020, 95:1-7.PMID: 32251795. DOI: 10.1016/j.ijid.2020.03.057
- Contenti J, Occelli C, Lemoel F, Ferrari P, Levraut J. Presepsin versus other biomarkers to predict sepsis and septic shock in patients with infection defined by Sepsis-3 criteria: the PREDI study of diagnostic accuracy. Emergencias 2019, 31(5):311-317. PMID: 31625302
- Piccioni A, Baroni S, Rozzi G, Belvederi F, Leggeri S, Spagnuolo F, Novelli M, Pignataro G, Candelli M, Covino M et al. Evaluation of Presepsin for Early Diagnosis of Sepsis in the Emergency Department. J Clin Med 2025, 14(7).PMID: 40217929 PMCID: PMC11989492. DOI: 10.3390/jcm14072480
- Wang C, Zhang J, Liu L, Qin W, Luo N. Early predictive value of presepsin for secondary sepsis and mortality in intensive care unit patients with severe acute pancreatitis. Shock 2023, 59(4):560-568. PMID: 36719429. DOI: 10.1097/SHK.0000000000002088
- Wu J, Zhan X, Wang S, Liao X, Li L, Luo J. The value of plasma presepsin as a diagnostic and prognostic biomarker for sepsis in Southern China. Inflamm Res 2023, 72(9):1829-1837.PMID: 37668612. DOI: 10.1007/s00011-023-01787-z
- Yamamoto T, Nishimura T, Kaga S, Uchida K, Tachibana Y, Esaki M, Fukushima W, Kondo K, Mizobata Y. Diagnostic accuracy of presepsin for sepsis by the new Sepsis-3 definitions. Am J Emerg Med 2019, 37(10):1936-1941.PMID: 30661874. DOI: 10.1016/j.ajem.2019.01.025
- Zhang X, Liu D, Liu YN, Wang R, Xie LX. The accuracy of presepsin (sCD14-ST) for the diagnosis of sepsis in adults: a meta-analysis. Crit Care 2015, 19(1):323.PMID: 26357898 PMCID: PMC4566362. DOI: 10.1186/s13054-015-1032-4
- Dellinger RP, Levy MM, Carlet JM, Bion J, Parker MM, Jaeschke R, Reinhart K, Angus DC, Brun-Buisson C, Beale R et al. Surviving Sepsis Campaign: international guidelines for management of severe sepsis and septic shock. 2008. Crit Care Med 2008, 36(1):296-327.PMID: 18158437. DOI: 10.1097/01.CCM.0000298158.12101.41
- Shirakawa K, Naitou K, Hirose J, Takahashi T, Furusako S. Presepsin (sCD14-ST): development and evaluation of one-step ELISA with a new standard that is similar to the form of presepsin in septic patients. Clin Chem Lab Med 2011, 49(5):937-939.PMID: 21345045. DOI: 10.1515/CCLM.2011.145
- Shozushima T, Takahashi G, Matsumoto N, Kojika M, Okamura Y, Endo S. Usefulness of presepsin (sCD14-ST) measurements as a marker for the diagnosis and severity of sepsis that satisfied diagnostic criteria of systemic inflammatory response syndrome. J Infect Chemother 2011, 17(6):764-769. PMID: 21560033. DOI: 1007/s10156-011-0254-x
- Hosokawa K, Obara H, Fukuda K, Mastubara K, Kitagawa Y. Specificity of Presepsin as a Biomarker of Bacterial Infection in Mouse Sepsis Models. J Surg Res 2023, 283:572-580.PMID: 36442256. DOI: 10.1016/j.jss.2022.10.063
- Behnes M, Bertsch T, Lepiorz D, Lang S, Trinkmann F, Brueckmann M, Borggrefe M, Hoffmann U. Diagnostic and prognostic utility of soluble CD 14 subtype (presepsin) for severe sepsis and septic shock during the first week of intensive care treatment. Crit Care 2014, 18(5):507. PMID: 25190134 PMCID: PMC4174283. DOI: 10.1186/s13054-014-0507-z
- Chenevier-Gobeaux C, Borderie D, Weiss N, Mallet-Coste T, Claessens YE. Presepsin (sCD14-ST), an innate immune response marker in sepsis. Clin Chim Acta 2015, 450:97-103.PMID: 26164388.DOI: 1016/j.cca.2015.06.026
- Kondo Y, Umemura Y, Hayashida K, Hara Y, Aihara M, Yamakawa K. Diagnostic value of procalcitonin and presepsin for sepsis in critically ill adult patients: a systematic review and meta-analysis. J Intensive Care 2019, 7:22.PMID: 31016020 PMCID: PMC6466719. DOI: 10.1186/s40560-019-0374-4
- Kweon OJ, Choi JH, Park SK, Park AJ. Usefulness of presepsin (sCD14 subtype) measurements as a new marker for the diagnosis and prediction of disease severity of sepsis in the Korean population. J Crit Care 2014, 29(6):965-970. PMID: 25042676. DOI: 10.1016/j.jcrc.2014.06.014
- Ulla M, Pizzolato E, Lucchiari M, Loiacono M, Soardo F, Forno D, Morello F, Lupia E, Moiraghi C, Mengozzi G et al. Diagnostic and prognostic value of presepsin in the management of sepsis in the emergency department: a multicenter prospective study. Crit Care 2013, 17(4):R168. PMID: 23899120 PMCID:PMC4056762.DOI:10.1186/cc12847
- Vodnik T, Kaljevic G, Tadic T, Majkic-Singh N. Presepsin (sCD14-ST) in preoperative diagnosis of abdominal sepsis. Clin Chem Lab Med 2013, 51(10):2053-2062.PMID: 23740685. DOI: 10.1515/cclm-2013-0061
- Zhou Y, Ren D, Chen Y, Wen S, Zhang Y, Song F, Yang M, Eisenhut M, O'Rourke J, Li Y et al. Presepsin, procalcitonin, interleukin-6, and high-sensitivity C-reactive protein for predicting bacterial DNAaemia among patients with sepsis. J Thorac Dis 2025, 17(2):991-1001.PMID: 40083506 PMCID: PMC11898362. DOI: 10.21037/jtd-24-1714
- Lan HM, Wu CC, Liu SH, Li CH, Tu YK, Chen KF. Comparison of the diagnostic accuracies of various biomarkers and scoring systems for sepsis: A systematic review and Bayesian diagnostic test accuracy network meta-analysis. J Crit Care 2025, 88:155087.PMID: 40245524. DOI: 1016/j.jcrc.2025.155087
- You P, Gao RY, Han YZ, Zhang XK, Li WX, Huang LF. Postoperative plasma presepsin as a biomarker of postoperative infectious complications in different surgical departments: A meta-analysis and systematic review. Am J Surg 2024, 229:65-75.PMID: 38065723. DOI: 10.1016/j.amjsurg.2023.11.024
- Chuang CL, Yeh HT, Niu KY, Chen CB, Seak CJ, Yen CC. Diagnostic performances of procalcitonin and C-reactive protein for sepsis: a systematic review and meta-analysis. Eur J Emerg Med 2025, 32(4):248-258.PMID: 40214293. DOI:10.1097/MEJ.0000000000001235
- Julián-Jiménez A, García de Guadiana-Romualdo L, Merinos-Sánchez G, García DE. Diagnostic accuracy of procalcitonin for bacterial infection in the Emergency Department: a systematic review. Rev Clin Esp (Barc) 2024, 224(6):400-416.PMID: 38815753. DOI: 10.1016/j.rceng.2024.05.006
- Kubo K, Sakuraya M, Sugimoto H, Takahashi N, Kano KI, Yoshimura J, Egi M, Kondo Y. Benefits and Harms of Procalcitonin- or C-Reactive Protein-Guided Antimicrobial Discontinuation in Critically Ill Adults With Sepsis: A Systematic Review and Network Meta-Analysis. Crit Care Med 2024, 52(10):e522-e534. DOI: 1097/CCM.0000000000006366
- Qiu B, Huang J, Zhang F, Wang Y. Meta-analysis of the accuracy of CD64, HBP, and PCT in differential diagnosis of sepsis patients. J Infect Dev Ctries 2025, 19(5):755-765.PMID: 40452537. DOI: 10.3855/jidc.20063
- Zaki HA, Bensliman S, Bashir K, Iftikhar H, Fayed MH, Salem W, Elmoheen A, Yigit Y. Accuracy of procalcitonin for diagnosing sepsis in adult patients admitted to the emergency department: a systematic review and meta-analysis. Syst Rev 2024, 13(1):37. PMID: 38254218 PMCID: PMC10802075. DOI: 10.1186/s13643-023-02432-w
- Nasa P, Juneja D, Singh O, Dang R, Arora V. Severe sepsis and its impact on outcome in elderly and very elderly patients admitted in intensive care unit. J Intensive Care Med 2012, 27(3):179-183.PMID: 21436163. DOI: 10.1177/0885066610397116
- Nasa P, Juneja D, Singh O. Severe sepsis and septic shock in the elderly: An overview. World J Crit Care Med 2012, 1(1):23-30.PMID: 24701398 PMCID: PMC3956061. DOI: 10.5492/wjccm.v1.i1.23
- Raith EP, Udy AA, Bailey M, McGloughlin S, MacIsaac C, Bellomo R, Pilcher DV. Prognostic Accuracy of the SOFA Score, SIRS Criteria, and qSOFA Score for In-Hospital Mortality Among Adults With Suspected Infection Admitted to the Intensive Care Unit. Jama 2017, 317(3):290-300.PMID: 28114553. DOI: 10.1001/jama.2016.20328
- Nakashima T, Miyamoto K, Shimokawa T, Kato S, Hayakawa M. The Association Between Sequential Organ Failure Assessment Scores and Mortality in Patients With Sepsis During the First Week: The JSEPTIC DIC Study. J Intensive Care Med 2020, 35(7):656-662. PMID: 29764273. DOI: 10.1177/0885066618775959
- Lie KC, Lau CY, Van Vinh Chau N, West TE, Limmathurotsakul D. Utility of SOFA score, management and outcomes of sepsis in Southeast Asia: a multinational multicenter prospective observational study. J Intensive Care 2018, 6:9. PMID: 29468069 PMCID: PMC5813360. DOI: 10.1186/s40560-018-0279-7
- Jones AE, Trzeciak S, Kline JA. The Sequential Organ Failure Assessment score for predicting outcome in patients with severe sepsis and evidence of hypoperfusion at the time of emergency department presentation. Crit Care Med 2009, 37(5):1649-1654. PMID: 19325482 PMCID: PMC2703722. DOI: 10.1097/CCM.0b013e31819def97
- Christensen EE, Prebensen CH, Martinsen AB, Stiff ET, Hoff R, Kvale D, Holten AR. Mortality and Sequential Organ Failure Assessment Score in Patients With Suspected Sepsis: The Impact of Acute and Preexisting Organ Failures and Infection Likelihood. Crit Care Explor 2023, 5(2):e0865. PMID: 36844375 PMCID: PMC9949839. DOI: 10.1097/CCE.0000000000000865