Ban Mahdi Salih 1 , Ammar M. Ali 2 , Mansour Bayati 3
Authors affiliations:
Background & objective: This research focuses on developing a novel chemiluminescence (CL) detection device for measuring Fe (III) concentration using a mobile phone-based system. The study addresses the need for a more sensitive and cost-effective method to detect iron (III), particularly in the blood of Thalassemia patients.
Methodology: The device utilizes a highly sensitive photosensor and features a simple, user-friendly design. The experimental section describes the development of the device, which measures the light intensity produced by the reaction between luminol and hydrogen peroxide in the presence of Fe (III) as a catalyst.
Results: Optimal reaction conditions were established to ensure accurate measurements. Light intensity was detected using a mobile phone equipped with the Remote XY application, which converted the signal into millivolts (mV) for analysis. The calibration curve followed Beer's law within a concentration range of 1×10⁻⁵ to 1×10⁻¹ M, with a molar absorption coefficient (Ɛ) of 2.09 × 10⁵ L·mol⁻¹·cm⁻¹. The limit of detection (LOD) was determined to be 0.21 ppm, and the limit of quantification (LOQ) was 0.7 ppm, with a correlation coefficient (R²) of 0.9997 and a relative standard deviation (RSD%) of 0.082%.
Conclusions: The device was tested on 25 blood samples from thalassemia patients, and the results were validated against a colorimetric Cromatest kit. The T-test and F-test values of 1 and 0.976, respectively, indicate strong agreement between the two methods.
Keywords: Bioluminescence; Chemiluminescence; Luminol; Photo sensor; Thalassemia
Citation: Salih BM, Ali AM, Bayati M. Determination of iron concentration in blood using a chemiluminescence method with a mobile phone-based detector. Anaesth Pain Intensive Care. 2025;29(x):932-940. DOI: 10.35975/apic.v29i.3020.
Received: July 18, 2025; Revised: August 05, 2025; Accepted: August 06, 2025
Chemiluminescence (CL) and bioluminescence (BL) are powerful analytical techniques increasingly adopted across clinical diagnostics, life sciences, environmental monitoring, and pharmaceutical testing due to their high sensitivity and favorable signal-to-noise ratio.1 Unlike traditional photoluminescent methods, CL/BL does not require an external light source, simplifying instrumentation and enabling adaptation to miniaturized or field-based devices.2 These properties make CL/BL well-suited for portable analytical platforms such as microfluidic systems and mobile-enabled sensors.3 Among chemiluminescence (CL) applications, the quantification of iron, particularly Fe³⁺ and Fe²⁺, has gained considerable interest. Several CL-based analytical systems have been developed for Fe³⁺ detection, including the sulfoflavine–H₂O₂–NaOH–acetonitrile flow system.⁴ However, most existing CL assays require benchtop instrumentation, which restricts their portability and limits their applicability in decentralized or resource-limited environments.5 In healthy individuals, the total body iron content typically ranges from 3 to 6 grams, averaging around 4–5 grams depending on hemoglobin levels and body weight.6 In contrast, thalassemia patients often suffer from severe iron overload due to frequent transfusions and ineffective erythropoiesis. Serum ferritin levels in such patients can range from 276 to over 8000ng/mL7, and hepatic iron concentrations may reach 1.6 to 31.0 mg/g dry weight, highlighting the prevalence of siderosis in this population.8 Iron overload is a critical clinical issue in thalassemia major, leading to progressive organ damage. Effective management requires routine monitoring and chelation therapy.9 While serum ferritin (SF) is a widely used biomarker for assessing iron load, its accuracy is compromised by confounding factors such as inflammation.10 More precise techniques like magnetic resonance imaging (MRI) exist but remain costly and inaccessible in many clinical settings.11 Conventional methods for Fe³⁺ determination, including atomic absorption spectrometry (AAS) and inductively coupled plasma mass spectrometry (ICP-MS), offer excellent sensitivity and precision.¹² However, these methods are costly and unsuitable for portable or field-based diagnostics.¹³ There is a growing need for accessible, low-cost alternatives for Fe³⁺ quantification, particularly in clinical or decentralized settings.¹⁴ This study presents a novel chemiluminescence-based detection system that integrates a homemade light sensor with a mobile phone for signal processing.¹⁵ While the system does not surpass the sensitivity of advanced laboratory instruments, it provides a reliable, affordable, and portable platform for Fe³⁺ determination. We hypothesize that this semi-automated, low-cost CL system can achieve clinically acceptable accuracy for Fe³⁺ detection in blood samples.
Analytical-grade chemicals were used throughout the study. All solutions were prepared using deionized water with a conductivity of less than 0.2 µS/cm. Experimental procedures were conducted at room temperature (25–30 °C). A carbonate buffer solution (1.0 L, pH 10) was prepared by dissolving 10.50 g of sodium carbonate (Na₂CO₃) in approximately 900 mL of deionized water, followed by the addition of 20.0 mL of 0.5 M sodium hydroxide (NaOH) solution. The final volume was adjusted to 1.0 L with deionized water. A 0.02 M solution of luminol (5-amino-2,3-dihydro-1,4-phthalazinedione, ≥97%) was prepared by dissolving 0.3544 g of luminol (Sigma-Aldrich, St. Louis, MO, USA) in 100 mL of the prepared carbonate buffer (pH 10), as described in previously reported chemiluminescence protocols.16
A 0.1 M solution of potassium ferricyanide (K₃[Fe (CN)₆]) was prepared by dissolving 0.6580 g of the salt in deionized water and adjusting the volume to 20.0 mL. Potassium ferricyanide was used as a catalyst to enhance the chemiluminescent reaction. A 0.5 M hydrogen peroxide (H₂O₂) solution was prepared by diluting 30 mL of 30% (w/w) hydrogen peroxide (density = 1.13 g/mL, Sigma-Aldrich) with deionized water to a final volume of 250 mL.
Two chemiluminescence (CL) detection setups were employed in this study. The first system was a computer-controlled, bench-top CL sensing device designed for high-resolution signal acquisition. The second was a portable, smartphone-based CL detector developed as a low-cost alternative for field-based or point-of-care applications. Both systems were assembled and tested in the Department of Chemistry, Ministry of Science and Technology (Iraq), and the Chemistry Research Laboratory at the University of Kufa.
This study involved the analysis of 25 blood serum samples obtained from patients diagnosed with thalassemia major. The samples were collected from Al-Sader Educational Hospital under the supervision of clinical staff. All samples were anonymized before analysis and were stored at 4 °C until use. Ethical approval for this study was obtained from the National Bioethics Committee (approval number 013, dated 3 March 2023). Written informed consent was secured from all participants or their legal guardians, in accordance with the Declaration of Helsinki and institutional guidelines.
A 0.1 M stock solution of iron (III) was prepared by dissolving an appropriate amount of ferric nitrate nonahydrate (Fe(NO₃)₃·9H₂O) in deionized water. Working standard solutions were obtained by serial dilution of the stock to concentrations ranging from 1 × 10⁻⁶ M to 1 × 10⁻¹ M for calibration purposes.17 A 0.1 M luminol (5-amino-2,3-dihydro-1,4-phthalazinedione) solution was freshly prepared in a carbonate buffer at pH 10, composed of sodium carbonate and sodium bicarbonate. Hydrogen peroxide (15% v/v) was prepared by diluting a 30% (w/w) H₂O₂ solution with deionized water and was used as the oxidizing agent.18 All prepared solutions were stored at 4 °C and were protected from light to maintain stability. Calibration curves were constructed by injecting different concentrations of Fe (III) into the chemiluminescence (CL) system under optimized luminol and hydrogen peroxide conditions.
A homemade CL sensing system is shown in Figure 1, and an overview of the detector and CL connection devices that were employed in this work is shown in Figure 2. The signal was obtained after the sample was injected into the reaction vessel using a syringe, and the photocell detected the visible light emitted during the reaction. In the laboratory, a homemade system was constructed, using a 10 mL test tube as the reaction vessel. The signal was then analyzed and transmitted to a mobile phone via an Arduino board and Bluetooth technology. It is by converting this light into a signal using an Arduino, sending it to a mobile via Bluetooth and providing signal data. The mobile device (Huawei Y7 Prime) read out the signal as a result of the CL intensity through the peak height.
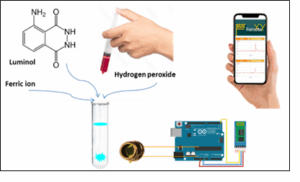
Figure 1. A home-made CL sensing system
The chemical variables, such as the concentration of reactants employed for the CL reaction and some other factors, were studied in a series of tests to determine the conditions for the creation of maximal CL emission. Physical factors such as volume were investigated.
Working and standard solutions were prepared by serially diluting the stock solution across appropriate concentration ranges to construct the standard curve and determine the detection limit. Additional parameters considered for Fe³⁺ measurement included repeatability, relative standard deviation, accuracy, recovery, and the regression coefficient.
Standard ferric solutions were prepared by accurately weighing the required amount, transferring it to a beaker, dissolving it, and then transferring the solution to a 250 mL graduated flask as a stock solution, making up to the mark. The homemade device was then used to determine Fe³⁺ levels in patients with thalassemia. Blood samples were collected from 25 thalassemia patients, and the results obtained using our device were compared with those from standard laboratory photometric methods.
3. RESULTS & DISCUSSION
The analytical performance of the developed device was compared with conventional methods. Although the limit of detection (LOD) and relative standard deviation (RSD) values demonstrate high reliability, the sensitivity does not exceed that of state-of-the-art laboratory methods such as AAS and ICP-MS. However, the proposed approach offers significant advantages, including portability, ease of operation, and low-cost implementation, making it suitable for point-of-care diagnostics or for laboratories with limited access to high-end instrumentation.
The device developed in this study integrates a batch-type chemiluminescence (CL) reaction system with a mobile phone-based detection unit. This setup consists of a sealed reaction vessel coupled with a light-detection sensor, controlled via an Arduino microcontroller and interfaced wirelessly with a mobile phone through Bluetooth communication. The purpose of this configuration is to provide a low-cost, portable, and easy-to-assemble platform for Fe (III) determination using CL signals.¹⁹
Figure 2 illustrates the assembled system. The primary components include a reaction vessel holder (Figure 2C), a photosensor module (Figure 2D), an Arduino microcontroller (Figure 2E), a Bluetooth module (Figure 2F), and the mobile phone display unit (Figures 2G and 2H). The entire system was enclosed in a manually constructed, light-proof box (Figure 2B) to eliminate background light and enhance signal stability. The housing was painted black internally to minimize light reflection and noise.²⁰
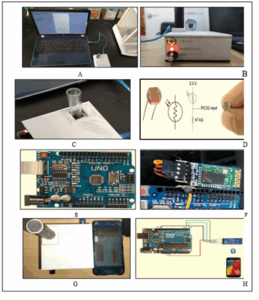
Figure 2: The general scheme of the CL system fabricated in this study
The detection system uses a light-dependent resistor (LDR), specifically the Advanced Photonix PDV-P5002, which operates based on photoconductivity principles. This sensor exhibits resistance from approximately 500 kΩ in dark conditions to about 10 kΩ under bright light, corresponding to the CL signal intensity. It responds to wavelengths between 370 and 700 nm, which aligns well with the visible emission from luminol-based CL reactions.²¹
A syringe is used to inject luminol, hydrogen peroxide, and Fe (III) into the reaction vessel, initiating the CL reaction. The emitted light is detected by the LDR and transmitted as an analog signal to the Arduino, which then sends the data to a mobile phone using the Remote XY application. An operational amplifier connected to the LDR enhances the system’s sensitivity by amplifying the voltage signal generated during light emission. Additionally, a variable resistor allows fine-tuning of the signal output.²²
To ensure consistent power delivery and portability, the device is powered via a standard USB connection (5V supply). A rubber tip is used to seal the injection port and prevent ambient light interference during measurements. Signal data, including light intensity as a function of time and reagent concentration, is recorded and visualized on the mobile phone in real-time.²³
This design eliminates the need for conventional, bulky equipment such as photomultiplier tubes (PMTs), monochromators, or external excitation sources. Instead, it provides a compact, cost-effective, and user-friendly alternative capable of delivering reliable analytical performance in laboratory or field settings. The system's ability to produce a stable baseline and consistent response across multiple trials demonstrates its suitability for practical chemiluminescence applications.²⁴ In recent years, homemade and open-source analytical devices have gained increasing global attention as practical alternatives to traditional spectrophotometers, particularly in educational and resource-limited settings.²⁵
The batch-type chemiluminescence (B-CL) system was optimized to enable rapid and reproducible quantification of Fe (III). Experiments were conducted to determine the optimal conditions for luminol concentration, luminol volume, and Fe (III) volume. All experiments were performed at laboratory temperatures between 25 and 35°C using 1 mL of 15% hydrogen peroxide.
The chemiluminescent reaction is highly dependent on the concentration of luminol, particularly in alkaline media.²⁶ Different luminol concentrations in the range of 1 × 10⁻⁵ to 1 M were evaluated to identify conditions that produced the maximum and most reproducible CL signal. As shown in Table 1 and Figure 3, a luminol concentration of 1 × 10⁻¹ M resulted in the highest signal intensity, indicating its suitability for generating a strong and stable chemiluminescent response.
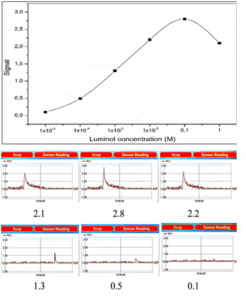
Figure 3: Effect of Luminol concentration on peak intensity
The influence of luminol volume on the CL signal was examined in the range of 0.25 to 2 mL. As shown in
Table 2 and Figure 4, the peak intensity increased with volume up to 1.0 mL, after which it began to decline. The data suggest that 1.0 mL provides the optimal reaction volume, likely due to the saturation of the reaction environment and maximal photon emission under the given conditions.²⁷ Fe (III) acts as a catalyst and significantly affects signal strength. As shown in Table 3 and Figure 5, increasing Fe (III) volume from 0.5 to 1.0 mL enhanced signal intensity, with a maximum observed at 1.0 mL. Beyond this, a decline in signal was noted, possibly due to quenching effects or excess catalytic decomposition of hydrogen peroxide.²⁸
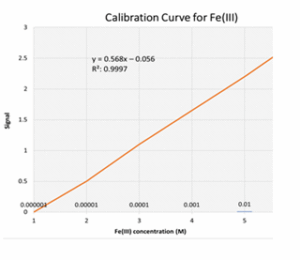
Figure 4: Calibration curve for Fe (III) concentration vs. CL signal
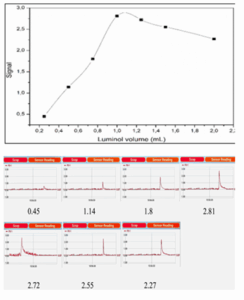
Figure 4. Effect of Luminol volume on CL intensity
The limit of detection (LOD) was estimated using signal-to-noise criteria (S/N ≥ 3), as outlined in Equation 1. Figure 6 presents a typical baseline response with peak and noise levels. The average peak-to-peak noise was 0.07 mV. Based on the calibration curve, the LOD of the device was calculated as 0.21 ppm.²⁹
Equation 1
The reproducibility of the device was assessed by analyzing seven replicates of Fe (III) under optimal conditions. The standard deviation (σ = 0.00534) and relative standard deviation (RSD% = 0.076%) are shown in Figure 7. These results confirm the high repeatability of the proposed method.³⁰
A calibration curve was established across a concentration range from 1 × 10⁻⁶ M to 1 × 10⁻¹ M. Table 5 and Figure 8 show the measured signal values and the corresponding linear relationship (R² = 0.9997). The regression equation was y = 0.568x – 0.056, with an LOD of 3.807 ppm and a limit of quantification (LOQ) of 12.69 ppm.³¹
To validate the system, recovery studies were performed using two Fe (III) samples. Results in Table 6 show excellent agreement between expected and measured values, with recovery ranging from 98.50% to 100.11%, confirming the system’s accuracy.³²
The proposed B-CL system was used to analyze two commercial Fe (III) formulations. As shown in Table 7, the recovery rates (98.75%–99.05%) closely matched the declared concentrations, confirming the method’s applicability in routine pharmaceutical analysis. A comparison was made between the homemade device and a commercial Cromatest® colorimetric kit (Linear Chemicals, Spain) for measuring serum Fe (III). The method is based on releasing Fe (III) from transferrin in an acidic medium, reduction to Fe²⁺, and subsequent formation of a colored Ferrozine complex. Results from 25 serum samples (Table 8) shows excellent agreement between the two methods, with high accuracy and low RSD% values.³³ The reagents used included: Reagent 1, buffer/reductant (guanidine chloride 1.0 mol/L, hydroxylamine 0.6 mol/L, acetate buffer 400 mmol/L, pH 4.0, Teepol); Reagent 2, chromogen (FerroZine 8 mmol/L, sodium acetate 400 mmol/L); and Reagent 3, iron standard (100 µg/dL Fe³⁺; 17.9 µmol/L).³⁴
Since the study was conducted using a new technique to estimate the elements in the blood, several factors must be improved in the technique to enhance its accuracy and precision.
This study presents a novel, low-cost, and semi-automated chemiluminescence (CL) detection system designed for the quantification of iron (III), particularly in clinical samples from thalassemia patients. The device integrates a batch-type CL reaction vessel with a mobile phone-based detector, enabling real-time signal acquisition through Bluetooth communication. The system offers several advantages: it is simple to construct, highly reproducible, and eliminates the need for expensive equipment such as photomultiplier tubes or spectrophotometers. Under optimized conditions, the device demonstrated good linearity, sensitivity, and accuracy. Comparative analysis with a commercial colorimetric kit confirmed the reliability of the measurements, showing excellent recovery and precision.
Although the sensitivity of this system does not surpass advanced techniques like atomic absorption spectrometry (AAS) or inductively coupled plasma mass spectrometry (ICP-MS), its affordability, portability, and ease of use make it highly suitable for decentralized laboratories and point-of-care diagnostics. Furthermore, the platform can be adapted to various chemiluminescent reagents and integrated into flow injection or microfluidic systems, expanding its potential applications in environmental, pharmaceutical, and clinical fields. Overall, the chemiluminescence-based device provides an innovative, simple, and cost-effective approach for determining Fe (III) concentrations, especially in clinical samples such as blood from thalassemia patients. Its combination of affordability, portability, and user-friendliness offers a practical alternative for on-site analysis and decentralized laboratory settings.
MB: Manuscript writing
All authors have read and approved the final draft.
Authors affiliations:
- Ban Mahdi Salih, Department of Pharmacy, Technical Institutes, Al-Furat Al-Awsat Technical University, Kufa, Iraq.
- Ammar M. Ali, Department of Chemistry, College of Sciences, University of Kufa, Al-Najaf, Iraq; Email: hamza@uokufa.edu.iq
- Mansour Bayati, Department of Chemistry, College of Sciences, University of Kufa, Al-Najaf, Iraq; Email: ali@uokufa.edu.iq
ABSTRACT
Background & objective: This research focuses on developing a novel chemiluminescence (CL) detection device for measuring Fe (III) concentration using a mobile phone-based system. The study addresses the need for a more sensitive and cost-effective method to detect iron (III), particularly in the blood of Thalassemia patients.
Methodology: The device utilizes a highly sensitive photosensor and features a simple, user-friendly design. The experimental section describes the development of the device, which measures the light intensity produced by the reaction between luminol and hydrogen peroxide in the presence of Fe (III) as a catalyst.
Results: Optimal reaction conditions were established to ensure accurate measurements. Light intensity was detected using a mobile phone equipped with the Remote XY application, which converted the signal into millivolts (mV) for analysis. The calibration curve followed Beer's law within a concentration range of 1×10⁻⁵ to 1×10⁻¹ M, with a molar absorption coefficient (Ɛ) of 2.09 × 10⁵ L·mol⁻¹·cm⁻¹. The limit of detection (LOD) was determined to be 0.21 ppm, and the limit of quantification (LOQ) was 0.7 ppm, with a correlation coefficient (R²) of 0.9997 and a relative standard deviation (RSD%) of 0.082%.
Conclusions: The device was tested on 25 blood samples from thalassemia patients, and the results were validated against a colorimetric Cromatest kit. The T-test and F-test values of 1 and 0.976, respectively, indicate strong agreement between the two methods.
Keywords: Bioluminescence; Chemiluminescence; Luminol; Photo sensor; Thalassemia
Citation: Salih BM, Ali AM, Bayati M. Determination of iron concentration in blood using a chemiluminescence method with a mobile phone-based detector. Anaesth Pain Intensive Care. 2025;29(x):932-940. DOI: 10.35975/apic.v29i.3020.
Received: July 18, 2025; Revised: August 05, 2025; Accepted: August 06, 2025
1. INTRODUCTION
Chemiluminescence (CL) and bioluminescence (BL) are powerful analytical techniques increasingly adopted across clinical diagnostics, life sciences, environmental monitoring, and pharmaceutical testing due to their high sensitivity and favorable signal-to-noise ratio.1 Unlike traditional photoluminescent methods, CL/BL does not require an external light source, simplifying instrumentation and enabling adaptation to miniaturized or field-based devices.2 These properties make CL/BL well-suited for portable analytical platforms such as microfluidic systems and mobile-enabled sensors.3 Among chemiluminescence (CL) applications, the quantification of iron, particularly Fe³⁺ and Fe²⁺, has gained considerable interest. Several CL-based analytical systems have been developed for Fe³⁺ detection, including the sulfoflavine–H₂O₂–NaOH–acetonitrile flow system.⁴ However, most existing CL assays require benchtop instrumentation, which restricts their portability and limits their applicability in decentralized or resource-limited environments.5 In healthy individuals, the total body iron content typically ranges from 3 to 6 grams, averaging around 4–5 grams depending on hemoglobin levels and body weight.6 In contrast, thalassemia patients often suffer from severe iron overload due to frequent transfusions and ineffective erythropoiesis. Serum ferritin levels in such patients can range from 276 to over 8000ng/mL7, and hepatic iron concentrations may reach 1.6 to 31.0 mg/g dry weight, highlighting the prevalence of siderosis in this population.8 Iron overload is a critical clinical issue in thalassemia major, leading to progressive organ damage. Effective management requires routine monitoring and chelation therapy.9 While serum ferritin (SF) is a widely used biomarker for assessing iron load, its accuracy is compromised by confounding factors such as inflammation.10 More precise techniques like magnetic resonance imaging (MRI) exist but remain costly and inaccessible in many clinical settings.11 Conventional methods for Fe³⁺ determination, including atomic absorption spectrometry (AAS) and inductively coupled plasma mass spectrometry (ICP-MS), offer excellent sensitivity and precision.¹² However, these methods are costly and unsuitable for portable or field-based diagnostics.¹³ There is a growing need for accessible, low-cost alternatives for Fe³⁺ quantification, particularly in clinical or decentralized settings.¹⁴ This study presents a novel chemiluminescence-based detection system that integrates a homemade light sensor with a mobile phone for signal processing.¹⁵ While the system does not surpass the sensitivity of advanced laboratory instruments, it provides a reliable, affordable, and portable platform for Fe³⁺ determination. We hypothesize that this semi-automated, low-cost CL system can achieve clinically acceptable accuracy for Fe³⁺ detection in blood samples.
2. METHODOLOGY
Analytical-grade chemicals were used throughout the study. All solutions were prepared using deionized water with a conductivity of less than 0.2 µS/cm. Experimental procedures were conducted at room temperature (25–30 °C). A carbonate buffer solution (1.0 L, pH 10) was prepared by dissolving 10.50 g of sodium carbonate (Na₂CO₃) in approximately 900 mL of deionized water, followed by the addition of 20.0 mL of 0.5 M sodium hydroxide (NaOH) solution. The final volume was adjusted to 1.0 L with deionized water. A 0.02 M solution of luminol (5-amino-2,3-dihydro-1,4-phthalazinedione, ≥97%) was prepared by dissolving 0.3544 g of luminol (Sigma-Aldrich, St. Louis, MO, USA) in 100 mL of the prepared carbonate buffer (pH 10), as described in previously reported chemiluminescence protocols.16
A 0.1 M solution of potassium ferricyanide (K₃[Fe (CN)₆]) was prepared by dissolving 0.6580 g of the salt in deionized water and adjusting the volume to 20.0 mL. Potassium ferricyanide was used as a catalyst to enhance the chemiluminescent reaction. A 0.5 M hydrogen peroxide (H₂O₂) solution was prepared by diluting 30 mL of 30% (w/w) hydrogen peroxide (density = 1.13 g/mL, Sigma-Aldrich) with deionized water to a final volume of 250 mL.
Two chemiluminescence (CL) detection setups were employed in this study. The first system was a computer-controlled, bench-top CL sensing device designed for high-resolution signal acquisition. The second was a portable, smartphone-based CL detector developed as a low-cost alternative for field-based or point-of-care applications. Both systems were assembled and tested in the Department of Chemistry, Ministry of Science and Technology (Iraq), and the Chemistry Research Laboratory at the University of Kufa.
This study involved the analysis of 25 blood serum samples obtained from patients diagnosed with thalassemia major. The samples were collected from Al-Sader Educational Hospital under the supervision of clinical staff. All samples were anonymized before analysis and were stored at 4 °C until use. Ethical approval for this study was obtained from the National Bioethics Committee (approval number 013, dated 3 March 2023). Written informed consent was secured from all participants or their legal guardians, in accordance with the Declaration of Helsinki and institutional guidelines.
A 0.1 M stock solution of iron (III) was prepared by dissolving an appropriate amount of ferric nitrate nonahydrate (Fe(NO₃)₃·9H₂O) in deionized water. Working standard solutions were obtained by serial dilution of the stock to concentrations ranging from 1 × 10⁻⁶ M to 1 × 10⁻¹ M for calibration purposes.17 A 0.1 M luminol (5-amino-2,3-dihydro-1,4-phthalazinedione) solution was freshly prepared in a carbonate buffer at pH 10, composed of sodium carbonate and sodium bicarbonate. Hydrogen peroxide (15% v/v) was prepared by diluting a 30% (w/w) H₂O₂ solution with deionized water and was used as the oxidizing agent.18 All prepared solutions were stored at 4 °C and were protected from light to maintain stability. Calibration curves were constructed by injecting different concentrations of Fe (III) into the chemiluminescence (CL) system under optimized luminol and hydrogen peroxide conditions.
A homemade CL sensing system is shown in Figure 1, and an overview of the detector and CL connection devices that were employed in this work is shown in Figure 2. The signal was obtained after the sample was injected into the reaction vessel using a syringe, and the photocell detected the visible light emitted during the reaction. In the laboratory, a homemade system was constructed, using a 10 mL test tube as the reaction vessel. The signal was then analyzed and transmitted to a mobile phone via an Arduino board and Bluetooth technology. It is by converting this light into a signal using an Arduino, sending it to a mobile via Bluetooth and providing signal data. The mobile device (Huawei Y7 Prime) read out the signal as a result of the CL intensity through the peak height.
Figure 1. A home-made CL sensing system
The chemical variables, such as the concentration of reactants employed for the CL reaction and some other factors, were studied in a series of tests to determine the conditions for the creation of maximal CL emission. Physical factors such as volume were investigated.
Working and standard solutions were prepared by serially diluting the stock solution across appropriate concentration ranges to construct the standard curve and determine the detection limit. Additional parameters considered for Fe³⁺ measurement included repeatability, relative standard deviation, accuracy, recovery, and the regression coefficient.
Standard ferric solutions were prepared by accurately weighing the required amount, transferring it to a beaker, dissolving it, and then transferring the solution to a 250 mL graduated flask as a stock solution, making up to the mark. The homemade device was then used to determine Fe³⁺ levels in patients with thalassemia. Blood samples were collected from 25 thalassemia patients, and the results obtained using our device were compared with those from standard laboratory photometric methods.
3. RESULTS & DISCUSSION
The analytical performance of the developed device was compared with conventional methods. Although the limit of detection (LOD) and relative standard deviation (RSD) values demonstrate high reliability, the sensitivity does not exceed that of state-of-the-art laboratory methods such as AAS and ICP-MS. However, the proposed approach offers significant advantages, including portability, ease of operation, and low-cost implementation, making it suitable for point-of-care diagnostics or for laboratories with limited access to high-end instrumentation.
The device developed in this study integrates a batch-type chemiluminescence (CL) reaction system with a mobile phone-based detection unit. This setup consists of a sealed reaction vessel coupled with a light-detection sensor, controlled via an Arduino microcontroller and interfaced wirelessly with a mobile phone through Bluetooth communication. The purpose of this configuration is to provide a low-cost, portable, and easy-to-assemble platform for Fe (III) determination using CL signals.¹⁹
Figure 2 illustrates the assembled system. The primary components include a reaction vessel holder (Figure 2C), a photosensor module (Figure 2D), an Arduino microcontroller (Figure 2E), a Bluetooth module (Figure 2F), and the mobile phone display unit (Figures 2G and 2H). The entire system was enclosed in a manually constructed, light-proof box (Figure 2B) to eliminate background light and enhance signal stability. The housing was painted black internally to minimize light reflection and noise.²⁰
Figure 2: The general scheme of the CL system fabricated in this study
The detection system uses a light-dependent resistor (LDR), specifically the Advanced Photonix PDV-P5002, which operates based on photoconductivity principles. This sensor exhibits resistance from approximately 500 kΩ in dark conditions to about 10 kΩ under bright light, corresponding to the CL signal intensity. It responds to wavelengths between 370 and 700 nm, which aligns well with the visible emission from luminol-based CL reactions.²¹
A syringe is used to inject luminol, hydrogen peroxide, and Fe (III) into the reaction vessel, initiating the CL reaction. The emitted light is detected by the LDR and transmitted as an analog signal to the Arduino, which then sends the data to a mobile phone using the Remote XY application. An operational amplifier connected to the LDR enhances the system’s sensitivity by amplifying the voltage signal generated during light emission. Additionally, a variable resistor allows fine-tuning of the signal output.²²
To ensure consistent power delivery and portability, the device is powered via a standard USB connection (5V supply). A rubber tip is used to seal the injection port and prevent ambient light interference during measurements. Signal data, including light intensity as a function of time and reagent concentration, is recorded and visualized on the mobile phone in real-time.²³
This design eliminates the need for conventional, bulky equipment such as photomultiplier tubes (PMTs), monochromators, or external excitation sources. Instead, it provides a compact, cost-effective, and user-friendly alternative capable of delivering reliable analytical performance in laboratory or field settings. The system's ability to produce a stable baseline and consistent response across multiple trials demonstrates its suitability for practical chemiluminescence applications.²⁴ In recent years, homemade and open-source analytical devices have gained increasing global attention as practical alternatives to traditional spectrophotometers, particularly in educational and resource-limited settings.²⁵
The batch-type chemiluminescence (B-CL) system was optimized to enable rapid and reproducible quantification of Fe (III). Experiments were conducted to determine the optimal conditions for luminol concentration, luminol volume, and Fe (III) volume. All experiments were performed at laboratory temperatures between 25 and 35°C using 1 mL of 15% hydrogen peroxide.
The chemiluminescent reaction is highly dependent on the concentration of luminol, particularly in alkaline media.²⁶ Different luminol concentrations in the range of 1 × 10⁻⁵ to 1 M were evaluated to identify conditions that produced the maximum and most reproducible CL signal. As shown in Table 1 and Figure 3, a luminol concentration of 1 × 10⁻¹ M resulted in the highest signal intensity, indicating its suitability for generating a strong and stable chemiluminescent response.
| Table 1: Signal values measured against
Luminol concentration |
||
| Signal values | Concentration
(M) of Luminol |
Signal |
| Signal values measured against Luminol concentration (M) | 1 x 10⁻⁵ | 0.1 |
| 1 x 10⁻⁴ | 0.5 | |
| 1 x 10⁻³ | 1.3 | |
| 1 x 10⁻² | 2.2 | |
| 1 x 10⁻¹ | 2.8 | |
| 1 | 2.1 | |
| Signal values measured against volume (mL) of Luminol (0.1M) | 0.25 | 0.45 |
| 0.5 | 1.14 | |
| 0.75 | 1.8 | |
| 1 | 2.81 | |
| 1.25 | 2.72 | |
| 1.5 | 2.55 | |
| 2 | 2.27 | |
| Signal values measured against Fe (III) volume (0.1M) | 0.5 | 2.00 |
| 1.0 | 2.80 | |
| 1.5 | 1.90 | |
| 2.0 | 1.60 | |
Figure 3: Effect of Luminol concentration on peak intensity
The influence of luminol volume on the CL signal was examined in the range of 0.25 to 2 mL. As shown in
Table 2 and Figure 4, the peak intensity increased with volume up to 1.0 mL, after which it began to decline. The data suggest that 1.0 mL provides the optimal reaction volume, likely due to the saturation of the reaction environment and maximal photon emission under the given conditions.²⁷ Fe (III) acts as a catalyst and significantly affects signal strength. As shown in Table 3 and Figure 5, increasing Fe (III) volume from 0.5 to 1.0 mL enhanced signal intensity, with a maximum observed at 1.0 mL. Beyond this, a decline in signal was noted, possibly due to quenching effects or excess catalytic decomposition of hydrogen peroxide.²⁸
| Table 2: Optimized parameters for Fe (III) determination using the B-CL system | |
| Parameters | Value |
| Cons. of Luminol | 0.1M |
| Luminol volume | 1 mL |
| Hydrogen peroxide Conc. | 15% |
| Hydrogen peroxide volume | 1 mL |
| Beer’s Law limits (μg/mL) (x) | 0.00001 – 0.1 M |
| Regression coefficient | R² = 0.9997 |
| R.S.D % | 0.082% |
| Standard Deviation ơ | 0.0057 |
| Regression equation (y = bx + a ) | y = 0.568x - 0.056 |
| Intercept | 0.056 |
| Slope | 0.568 |
| LOD (Limt of detection) | 3.807ppm |
| LOQ (Limt of quantification) | 12.69ppm |
| Molar absorptivity Ɛ | 209024 |
| Sandell’s sensitivity | 0.0017 |
| Table 3: Determination of Fe (III) in representative samples using the B-CL system | |||
| Determination Fe (III) by Ba-CL system* | Claimed
(mgL-) |
Sample | |
| Recovery%
± R.S.D% |
Found (mg L-) | ||
| 98.50 ± 0.11 | 9.85 | 10.00 | 1 |
| 100.11± 0.13 | 100.11 | 100.00 | 2 |
Figure 4: Calibration curve for Fe (III) concentration vs. CL signal
Figure 4. Effect of Luminol volume on CL intensity
The limit of detection (LOD) was estimated using signal-to-noise criteria (S/N ≥ 3), as outlined in Equation 1. Figure 6 presents a typical baseline response with peak and noise levels. The average peak-to-peak noise was 0.07 mV. Based on the calibration curve, the LOD of the device was calculated as 0.21 ppm.²⁹
Equation 1
The reproducibility of the device was assessed by analyzing seven replicates of Fe (III) under optimal conditions. The standard deviation (σ = 0.00534) and relative standard deviation (RSD% = 0.076%) are shown in Figure 7. These results confirm the high repeatability of the proposed method.³⁰
| Table 4:Signal values measured against Fe (III) concentration | |
| Fe(III) concentration (M) | Signal |
| 0.000001 | 0.00 |
| 0.000010 | 0.50 |
| 0.000100 | 1.10 |
| 0.001000 | 1.65 |
| 0.010000 | 2.20 |
| 0.100000 | 2.79 |
A calibration curve was established across a concentration range from 1 × 10⁻⁶ M to 1 × 10⁻¹ M. Table 5 and Figure 8 show the measured signal values and the corresponding linear relationship (R² = 0.9997). The regression equation was y = 0.568x – 0.056, with an LOD of 3.807 ppm and a limit of quantification (LOQ) of 12.69 ppm.³¹
| Table 5: Comparison of Fe (III) concentrations measured by the B-CL device and the Chromatist kit | ||||
| Concentration of Fe (III) (µg/dL) | *Recovery % *RSD% | T-Test | F-Test | |
| With Colorimetric Cromatest kit | With a
home-made device |
1 | 0.976363
|
|
| 251 | 250 | 100.00% ± 0.10 | ||
| 322 | 320 | 99.99% ± 0.19 | ||
| 284 | 286 | 100.01% ± 0.14 | ||
| 263 | 265 | 100.01% ± 0.21 | ||
| 390 | 389 | 100.00% ± 0.13 | ||
| 377 | 378 | 100.00% ± 0.16 | ||
| 362 | 364 | 100.01% ± 0.12 | ||
| 296 | 295 | 100.00% ± 0.20 | ||
| 266 | 265 | 100.00% ± 0.18 | ||
| 302 | 303 | 100.00% ± 0.12 | ||
| 287 | 288 | 100.00% ± 0.22 | ||
| 279 | 277 | 99.99% ± 0.21 | ||
| 263 | 262 | 100.00% ± 0.15 | ||
| 348 | 349 | 100.00% ± 0.14 | ||
| 367 | 368 | 100.00% ± 0.16 | ||
| 293 | 291 | 99.99% ± 0.13 | ||
| 271 | 270 | 100.00% ± 0.10 | ||
| 286 | 287 | 100.00% ± 0.15 | ||
| 333 | 335 | 100.01% ± 0.17 | ||
| 359 | 359 | 100.00% ± 0.17 | ||
| 319 | 320 | 100.00% ± 0.16 | ||
| 325 | 325 | 100.00% ± 0.12 | ||
| 364 | 364 | 100.00% ± 0.16 | ||
| 339 | 337 | 99.99% ± 0.19 | ||
| 342 | 341 | 100.00% ± 0.20 | ||
To validate the system, recovery studies were performed using two Fe (III) samples. Results in Table 6 show excellent agreement between expected and measured values, with recovery ranging from 98.50% to 100.11%, confirming the system’s accuracy.³²
The proposed B-CL system was used to analyze two commercial Fe (III) formulations. As shown in Table 7, the recovery rates (98.75%–99.05%) closely matched the declared concentrations, confirming the method’s applicability in routine pharmaceutical analysis. A comparison was made between the homemade device and a commercial Cromatest® colorimetric kit (Linear Chemicals, Spain) for measuring serum Fe (III). The method is based on releasing Fe (III) from transferrin in an acidic medium, reduction to Fe²⁺, and subsequent formation of a colored Ferrozine complex. Results from 25 serum samples (Table 8) shows excellent agreement between the two methods, with high accuracy and low RSD% values.³³ The reagents used included: Reagent 1, buffer/reductant (guanidine chloride 1.0 mol/L, hydroxylamine 0.6 mol/L, acetate buffer 400 mmol/L, pH 4.0, Teepol); Reagent 2, chromogen (FerroZine 8 mmol/L, sodium acetate 400 mmol/L); and Reagent 3, iron standard (100 µg/dL Fe³⁺; 17.9 µmol/L).³⁴
5. LIMITATIONS
Since the study was conducted using a new technique to estimate the elements in the blood, several factors must be improved in the technique to enhance its accuracy and precision.
6. CONCLUSION
This study presents a novel, low-cost, and semi-automated chemiluminescence (CL) detection system designed for the quantification of iron (III), particularly in clinical samples from thalassemia patients. The device integrates a batch-type CL reaction vessel with a mobile phone-based detector, enabling real-time signal acquisition through Bluetooth communication. The system offers several advantages: it is simple to construct, highly reproducible, and eliminates the need for expensive equipment such as photomultiplier tubes or spectrophotometers. Under optimized conditions, the device demonstrated good linearity, sensitivity, and accuracy. Comparative analysis with a commercial colorimetric kit confirmed the reliability of the measurements, showing excellent recovery and precision.
Although the sensitivity of this system does not surpass advanced techniques like atomic absorption spectrometry (AAS) or inductively coupled plasma mass spectrometry (ICP-MS), its affordability, portability, and ease of use make it highly suitable for decentralized laboratories and point-of-care diagnostics. Furthermore, the platform can be adapted to various chemiluminescent reagents and integrated into flow injection or microfluidic systems, expanding its potential applications in environmental, pharmaceutical, and clinical fields. Overall, the chemiluminescence-based device provides an innovative, simple, and cost-effective approach for determining Fe (III) concentrations, especially in clinical samples such as blood from thalassemia patients. Its combination of affordability, portability, and user-friendliness offers a practical alternative for on-site analysis and decentralized laboratory settings.
- Data availability
- Conflict of interest
- Funding
- Authors contribution
MB: Manuscript writing
All authors have read and approved the final draft.
10. REFERENCES
- Abbasi, R.; Hu, X.; Zhang, A.; Dummer, I.; Wachsmann-Hogiu, S. Optical Image Sensors for Smart Analytical Chemiluminescence Biosensors. Bioengineering 2024, 11 (9),912. [PubMed] DOI: 3390/bioengineering11090912
- Discovery, Identification, and Mode of Action of Phenolics from Marine-Derived Fungus Aspergillus Ustus as Antibacterial Wilt Agents. (ACS). [PubMed] DOI: 3390/bioengineering11090912
- Alberti, G.; Zanoni, C.; Magnaghi, L. R.; Biesuz, R. Deferoxamine-Based Materials and Sensors for Fe(III) Detection. Chemosensors 2022, 10 (11), 468. [FullText]
- Arnold, T. C.; Freeman, C. W.; Litt, B.; Stein, J. M. Low‐field MRI: Clinical Promise and Challenges. J. Magn. Reson. Imaging 2022, 57 (1), 25–44. [PubMed] DOI 1002/jmri.28408
- Bucher, J.; Quinson, J.; Mingers, A. M.; Zhang, D.; Arenz, M. On the Facile and Accurate Determination of the Pt Content in Standard Carbon Supported Pt Fuel Cell Catalysts. Anal. Chim. Acta 2020, 1101, 41–49. [PubMed] DOI: 1016/j.aca.2019.12.010
- Cassedy, A.; Mullins, E.; O’Kennedy, R. Sowing Seeds for the Future: The Need for on-Site Plant Diagnostics. Biotechnol. Adv..2020, 39, 107358. [PubMed] DOI: 1016/j.biotechadv.2019.02.014
- Chakraborty, S. Democratizing Nucleic Acid-Based Molecular Diagnostic Tests for Infectious Diseases at Resource-Limited Settings – from Point of Care to Extreme Point of Care. Sens. diagn2024, 3 (4),536–561. [FullText]
- Chen, Z.; Feng, S.; Wang, D. Organosilicon Fluorescent Materials. Polym 2023, 15 (2), 332.[PubMed] DOI: 3390/polym15020332
- Dignass, A.; Farrag, K.; Stein, J. Limitations of Serum Ferritin in Diagnosing Iron Deficiency in Inflammatory Conditions. Int. J. Chronic Dis 2018, 2018,1–11. [PubMed] DOI: 1155/2018/9394060
- Dortez, S.; Crevillen, A. G.; Escarpa, A. Integrated Calibration and Serum Iron in Situ Analysis into an Array Microfluidic Paper-Based Analytical Device with Smartphone Readout. Talanta 2023, 253, 123914. [PubMed] DOI: 1016/j.talanta.2022.123914
- Eksin, E.; Torul, H.; Yarali, E.; Tamer, U.; Papakonstantinou, P.; Erdem, A. Paper-Based Electrode Assemble for Impedimetric Detection of miRNA. Talanta 2021, 225, 122043.[PubMed] DOI: 1016/j.talanta.2020.122043
- Gao, J.; Wang, C.; Chu, Y.; Han, Y.; Gao, Y.; Wang, Y.; Wang, C.; Liu, H.; Han, L.; Zhang, Y. Graphene Oxide-Graphene Van Der Waals Heterostructure Transistor Biosensor for SARS-CoV-2 Protein Detection. Talanta 2022, 240, 123197. [PubMed] DOI: 1016/j.talanta.2021.123197
- Guo, Z.; Hong, J.; Song, N.; Liang, M. Single-Atom Nanozymes: From Precisely Engineering toExtensiveApplications. Acc. Mater. Res 2024, 5 (3),347–357. [FullText]
- He, Y.; Sun, X.; Yan, X.; Li, Y.; Zhong, K.; Tang, L. A Colorimetric, NIR, Ultrafast Fluorescent Probe for Ferric Iron Detection Based on the PET Mechanism and Its Multiple Applications. J. Mater. Chem C 2022, 10 (23),9009–9016. [FullText]
- Ibrahim, W. H.; Abokresha, M. M.; Nigm, D. A.; Abdelal, S. M.; Kelani, A.; Aly, M. G. Relation of Liver Siderosis to Liver Fibrosis in Hemodialysis Patients With Severe Hyperferritinemia Secondary to High Doses of Intravenous Iron Supplementation. J. Ren. Nutr 2023, 33 (2), 337–345.[PubMed] DOI: 1053/j.jrn.2022.08.004
- Kubo, Y.; Yamada, S.; Murakawa, H.; Asano, H. Pressure Drop and Flow Patterns of Boiling Flows in Mini-Channels with Semi-Circular Cross-Section. Appl. Therm. Eng 2021, 194,117096.[FullText]
- Li, K.; Li, Y.; Feng, R.; Wu, J. Enhancing of Luminol-H2O2 Chemiluminescence System by Bimetallic Metal–Organic Frameworks with Mixed Ligands. Catal 2024, 14 (12), 895.[FullText]
- McAdams, B. C.; Hudson, J.; Arnold, W. A.; Chin, Y.-P. Effects of Aquatic Dissolved Organic Matter Redox State on Adsorption to Goethite. Aquat. Sci2022, 85 (1).
- Michalke, B. Review about Powerful Combinations of Advanced and Hyphenated Sample Introduction Techniques with Inductively Coupled Plasma-Mass Spectrometry (ICP-MS) for Elucidating Trace Element Species in Pathologic Conditions on a Molecular Level. Int. J. Mol. Sci 2022, 23 (11), 6109.[PubMed] DOI: 3390/ijms23116109
- Miller, J. N. CHEMOMETRICS AND STATISTICS | Statistical Techniques. In EAC; Elsevier, 2005; pp 1–8. [FullText]
- Atheena, M. P. S.; Rashika, M.; Sri Manoj, K. N.; Aparna, N. A Comparative Exploration of Sensors and Biosensors in Analytical Detection. JELE 2024, 14 (3), 1.[FullText]
- Pearce, J. M. Building Research Equipment with Free, Open-Source Hardware. Sci 2012, 337 (6100), 1303–1304. [PubMed] DOI: 1126/science.1228183
- Pęgier, M.; Dróżdż, P.; Pomarański, P.; Pyrzyńska, K. Magnetic Hybrid Nanoparticles Modified with Morin for the Removal of Sc(III) from Aqueous Solutions. Microchem. J 2021, 170, 106683. [FullText]
- Pęgier, M.; Dróżdż, P.; Pomarański, P.; Pyrzyńska, K. Magnetic Hybrid Nanoparticles Modified with Morin for the Removal of Sc(III) from Aqueous Solutions. Microchem. J 2021, 170, 106683. [FullText]
- Pinto, V.; Forni, G. Management of Iron Overload in Beta-Thalassemia Patients: Clinical Practice Update Based on Case Series. Int. J. Mol. Sci. 2020, 21 (22),8771.[PubMed] DOI: 3390/ijms21228771
- Schultz, J.; Mrksich, M.; Bhatia, S. N.; Brady, D. J.; Ricco, A. J.; Walt, D. R.; Wilkins, C. L. Biosensing; Springer Netherlands, 2006.[FullText]
- Serhan, M.; Jackemeyer, D.; Long, M.; Sprowls, M.; Diez Perez, I.; Maret, W.; Chen, F.; Tao, N.; Forzani, E. Total Iron Measurement in Human Serum With a Novel Smartphone-Based Assay. IEEE J. Transl. Eng. Health Med. 2020, 8,1–9. [PubMed] DOI: 1109/JTEHM.2020.3005308
- Shah, N.; Arain, M. B.; Soylak, M. Historical Background: Milestones in the Field of Development of Analytical Instrumentation. In New Generation Green Solvents for Separation and Preconcentration of Organic and Inorganic Species; Elsevier, 2020; pp 45–73. [FullText]
- Koren, A.; Fink, D.; Admoni, O.; Tennenbaum-Rakover, Y.; Levin, C. Non Transferrin Bound Labile Plasma Iron and Iron Overload in Sickle Cell Disease: A Comparative Study Between Sickle Cell Disease and β Thalassemic Patients. Blood 2009, 114 (22), 4625–4625. [PubMed] DOI: 1111/j.1600-0609.2009.01342.x
- Wang, J. L.; Guo, Y. J.; Long, G. D.; Tang, Y. L.; Tang, Q. B.; Zu, X. T.; Ma, J. Y.; Du, B.; Torun, H.; Fu, Y. Q. Integrated Sensing Layer of Bacterial Cellulose and Polyethyleneimine to Achieve High Sensitivity of ST-Cut Quartz Surface Acoustic Wave Formaldehyde Gas Sensor. J. Hazard. Mater 2020, 388, 121743.[PubMed] DOI: 1016/j.jhazmat.2019.121743
- Wang, X.-L.; Han, X.; Tang, X.-Y.; Chen, X.-J.; Li, H.-J. A Review of Off–On Fluorescent Nanoprobes: Mechanisms, Properties, and Applications. J. Biomed. Nanotechnol 2021, 17 (7),1249–1272. [PubMed] DOI: 1166/jbn.2021.3117
- Xu, X.; Luo, P.; Yang, H.; Pan, S.; Liu, H.; Hu, X. Regulating the Enzymatic Activities of Metal-ATP Nanoparticles by Metal Doping and Their Application for H2O2 Detection. Sens. Actuators B: Chem. 2021, 335, 129671. [FullText]
- Yadav, A.; Yadav, K. Portable Solutions for Plant Pathogen Diagnostics: Development, Usage, and Future Potential. Front. Microbiol. 2025, 16.[PubMed] DOI: 3389/fmicb.2025.1516723
- Zhao, L.; Xu, J.; Xiong, L.; Wang, S.; Yu, C.; Lv, J.; Lin, J.-M. Recent Development of Chemiluminescence for Bioanalysis. TrAC, Trends Anal. Chem 2023, 166, 117213. [Full Text].