Mohammed H. Hassan 1 , Ferdous A. Jabir 2
Authors affiliations:
Background & objective: Type 2 diabetes mellitus (T2DM) significantly increases the risk of cardiovascular disease, including myocardial infarction (MI). Cathepsin D (CTSD), which is involved in the metabolic and inflammatory pathways, may serve as a diagnostic biomarker. This study investigated the association between the CTSD polymorphism (rs928508030) and MI in patients with T2DM, and evaluated CTSD, adiponectin, and TNF-α as diagnostic biomarkers.
Methodology: This cross-sectional study enrolled 120 participants: 40 controls, 40 T2DM patients, and 40 T2DM patients with MI. The serum levels of CTSD, adiponectin, and TNF-α were measured using ELISA. Genotyping of CTSD rs928508030 SNP was performed using tetra-ARMS PCR. Statistical analyses included ANOVA, chi-square tests, ROC curve analysis, and Pearson correlations.
Results: T2DM and MI patients exhibited significantly higher CTSD (374 ± 118 ng/L) and TNF-α (160 ± 52.8 ng/L) and lower adiponectin (9.0 ± 1.7 mg/L) levels than the controls (P < 0.001). The A allele of rs928508030 was enriched in the T2DM (54%) and T2DM and MI (51%) groups compared to the controls (0%, P < 0.001). ROC analysis demonstrated high diagnostic accuracy for CTSD (AUC=94%), adiponectin (AUC=93%), and TNF-α (AUC=93%) in MI detection. Positive correlations were found between CTSD and TNF-α (r=0.514) and HbA1c (r=0.554), whereas adiponectin was inversely correlated with metabolic inflammatory markers (P < 0.05).
Conclusion: CTSD rs928508030 A allele and elevated CTSD levels were associated with increased MI risk in T2DM patients. CTSD, along with adiponectin and TNF-α, exhibits strong diagnostic potential for MI in this population. These findings underscore the role of the genetic and inflammatory pathways in diabetic cardiovascular complications.
Abbreviations: CTSD: Cathepsin D, EDTA: Ethylene diamine tetraacetic acid, MI: myocardial infarction, T2DM: Type 2 diabetes mellitus, TNF-α: Tumor necrosis factor-alpha.
Keywords: Cathepsin D; Diabetes Mellitus; myocardial infarction; T2DM; TNF-α; adiponectin
Citation: Hassan FH, Jabir FA. Association of cathepsin D (CTSD) polymorphism and serum levels with myocardial infarction risk in type-2 diabetes mellitus. Anaesth. pain intensive care 2025;29(7):694-701. DOI: 10.35975/apic.v29i7.2944
Received: July 23, 2025; Revised: August 05, 2025; Accepted: August 09, 202
Type 2 diabetes mellitus (T2DM) is a chronic metabolic disorder characterized by elevated blood glucose levels owing to insulin resistance and/or relative insulin insufficiency. Unlike type 1 diabetes, which is caused by autoimmune destruction of pancreatic β-cells, T2DM develops gradually and is frequently associated with obesity, sedentary lifestyle, and hereditary vulnerability.1 According to recent estimates, T2DM has become an epidemic that affects over 500 million people worldwide. Its prevalence is expected to continue to increase, particularly in low- and middle-income nations (International Diabetes Federation, 2019). Owing to its increasing prevalence and heavy impact on healthcare systems, this illness is a serious public health problem.2 T2DM is associated with major long-term consequences, such as cardiovascular illnesses, nephropathy, retinopathy, and neuropathy, in addition to persistent hyperglycemia.3 Myocardial infarction (MI) continues to be among the most common causes of morbidity and death among individuals with diabetes.4 T2DM is a well-known risk factor for cardiovascular illnesses, including myocardial infarction (MI). Several biochemical indicators have been linked to the development of cardiovascular problems in individuals.5 Adipocytes produce the hormone adiponectin, which has anti-inflammatory and insulin-sensitizing properties. Lower circulating levels of adiponectin have been found in individuals with T2DM, and have been associated with an increased risk of MI, suggesting a protective function in vascular homeostasis.6 In contrast, TNF-α is a proinflammatory cytokine that increases insulin resistance and endothelial dysfunction. TNF-α levels are associated with T2DM and atherosclerosis, contributing to the inflammatory cascade that causes cardiovascular diseases in patients with diabetes.7
The Cathepsin D gene (CTSD) was precisely mapped to the short arm of chromosome 11 at position 15.5 (11p15.5). The gene spans approximately 11,173 bp on the complementary strand and comprises nine exons that undergo transcriptional and post-transcriptional regulation. This genomic organization facilitates the expression of multiple protein products through alternative splicing events, which ultimately contribute to the diversity of CTSD functions in various cellular compartments.8 Recent studies have identified several single-nucleotide polymorphisms (SNPs) within the CTSD gene that may influence CTSD expression and activity. Studies examining single nucleotide polymorphisms (SNPs) at the CTSD locus may modulate enzyme function and activity. These genetic variations appear to have substantial implications in both normal physiology and pathological conditions.9,10 In addition to genetic disorders, alterations in CTSD expression and activity have been implicated in the pathogenesis of various conditions including breast cancer and cardiovascular disorders.
In the context of T2DM, elevated CTSD levels may exacerbate insulin resistance and inflammatory pathways, potentially contributing to cellular damage and increased cardiovascular risk.11–13 CTSD is a protease enzyme from the acid protease family that is largely generated in lysosomes and destroys cellular proteins. CTSD plays a critical role in several fundamental cellular processes including apoptosis, autophagy, and cellular stress response control, making it an essential component of the biological balance of the immune system.14 Despite its critical role in these cellular activities, blood levels vary dramatically in chronic diseases such as type 2 diabetes and myocardial infarction.15 Higher CTSD levels in T2DM patients may aggravate insulin resistance and inflammatory indicators such as TNF-α, leading to cellular damage and a higher risk of cardiovascular disease.10 Furthermore, other studies have found that excessive levels of CTSD may cause vascular tissue rupture and degeneration, reinforcing the link between this enzyme and myocardial infarction.16 Despite extensive research on the role of CTSD in metabolic and cardiovascular pathologies, existing studies have predominantly focused on its expression or activity in isolation, either in T2DM or MI. A notable gap persists in our understanding of the interplay between CTSD genetic polymorphisms and their dual associations with T2DM and MI.
While prior investigations have linked CTSD to insulin resistance, inflammatory pathways, and cardiovascular complications, no comprehensive studies have directly examined the diagnostic potential of CTSD polymorphisms in MI among T2DM patients. This has limited the development of targeted biomarkers for early cardiovascular risk stratification in high-risk populations.
The study was conducted between December 2023 and March 2024 in the Department of Clinical Biochemistry and Chemistry at Al-Qadisiyah University, College of Medicine, on 120 individuals, including 40 patients with T2DM, 40 with T2DM plus MI, and 40 healthy controls. This study included experiments at the Al-Amin Center for Advanced Biotechnology and Research in Najaf Governorate and the Clinical Biochemistry Unit of the Laboratory Department at the Al-Zahraa Teaching Hospital. The mean age of the diabetic patients was 52.3 ± 8.2 years, while the mean age of the type 2 diabetic patients with MI was 57.4 ± 6.9 years. The control group consisted of 40 healthy, unrelated volunteers from the general population, with a mean age of 49 ± 5.8 years. Informed consent was obtained from all participants, and the study design was approved by the local ethics committee. Participants were asked to describe family and individual characteristics that increased their risk of coronary heart disease as well as their lifestyle choices. Diabetes was diagnosed by a physician, with appropriate tests confirming diabetes; patients with MI were diagnosed by a cardiologist. The exclusion criteria were: kidney disease, thyroid disease, autoimmune disease, congenital heart disease, other ischemic heart diseases such as angina pectoris and unstable angina, type 1 diabetes, and patients receiving insulin therapy.
2.1. Biochemical Analysis
Each patient had 5 mL of blood drawn from a vein and then separated into two test tubes: 2 mL with ethylene diamine tetraacetic acid (EDTA) for genetic study and 3 mL with a gel tube for biochemical analysis. The blood samples in the gel tubes were centrifuged at 3000-x g for ten minutes to obtain the serum. The serum was stored at -20°C until used.17 Serum levels of adiponectin: Catalog no. [E1550Hu], lot no. [202410010]; cathepsin D: catalog no. [E4668Hu], lot no. [202410010], and TNF-α: Catalog No. [E0082Hu], lot no. [202410010] were measured using enzyme-linked immunosorbent assay (ELISA) kits. All assays were performed in the laboratory of Al-Zahraa Teaching Hospital in Kut, according to the manufacturer's protocol.
2.2. DNA Extraction
The genotyping of the CTSD gene polymorphism was performed using the tetra amplification-refractory mutation system (TETRA-ARMS) technology and a specific set of primers. Genomic DNA was extracted from fresh human blood samples using the Wizard® Genomic DNA Purification Kit (Promega Corporation, USA; Cat. Nos. A1120, A1123, A1125, A1620; Lot No. 0000699929) following the manufacturer’s protocol.
Tetra-ARM PCR was used to determine the genotype of CTSD. Four primers were designed (Forward Outer, Forward Inner, Reverse Inner, and Reverse Outer). The CTSD gene, specifically targeting the G/A SNP (rs928508030), utilized a nested primer system for amplification, and the outer primers included the forward primer and reverse primer, generating a 170 bp product. Allele-specific inner primers included the forward primer (targeting the G allele) and reverse primer (targeting the A allele), which share sequence identity with the outer forward primer, but produce distinct smaller amplicons of 125 bp (G allele) and 100 bp (A allele) through nested PCR
2.3. Statistical analysis
Statistical analyses of the demographic and clinical characteristics of the individuals diagnosed with MI and DM were performed using GraphPad Prism® (version 9.3.1). Categorical variables were evaluated using the chi-square test. For datasets comprising more than two groups, one-way analysis of variance (ANOVA) was implemented, followed by Tukey’s post-hoc test for specific pairwise comparisons. Linear relationships between variables were examined using Pearson’s correlation coefficient. A significance level of P < 0.05 was applied to all statistical inferences. Data are expressed as mean ± standard deviation (SD) for normally distributed continuous variables, or as frequencies and percentages for categorical measures, consistent with their respective data types and distributional properties.
Table 1 summarizes the baseline demographic and clinical characteristics of the study cohort, including age, sex distribution, body mass index (BMI), and metabolic/inflammatory biomarkers (e.g., HbA1c, adiponectin, cathepsin, and TNF-α). Significant intergroup differences (one-way ANOVA, P < 0.001) were observed in glycemic markers (HbA1c), insulin resistance, and inflammatory mediators (TNF-α), with MI and DM participants exhibiting the highest values. Post hoc analysis revealed distinct subgroup differences (denoted by superscripts A, B, and C).
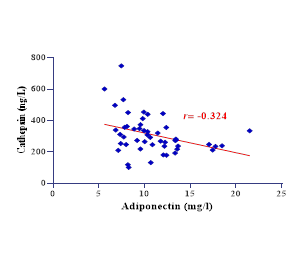
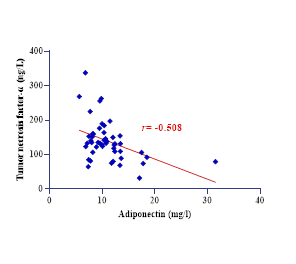
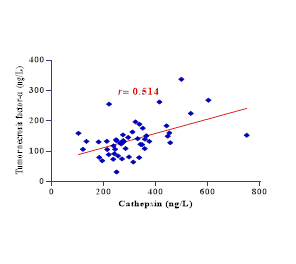
Figure 1: The different charts for Correlation between variables
This study evaluated the diagnostic performance of adiponectin, cathepsin, and TNF-α levels in patients with MI. All biomarkers showed high diagnostic accuracy, with AUC values ≥93%. Adiponectin showed the highest sensitivity and specificity, while TNF-α had the highest sensitivity, and cathepsin balanced sensitivity and specificity.
Pearson’s correlations among metabolic and inflammatory biomarkers revealed significant interrelationships (all P < 0.05). Cathepsin was correlated with TNF-α (r=0.514) and aligned with shared inflammatory pathways. Adiponectin is inversely associated with inflammatory mediators (e.g., r=−0.508 with TNF-α). Table 3 details the genotype (GG, GA, AA) and allele (G, A) frequencies of the CTSD rs928508030 SNP across control, DM, and MI & DM cohorts.
Genotype distributions and allele frequencies were analyzed using chi-square tests. The GG genotype was predominant in controls (100%), while GA and AA genotypes were significantly enriched in DM (40% GA, 28% AA) and MI & DM (50% GA, 23% AA) groups (P < 0.001). Similarly, the A allele frequency was markedly higher in DM (54%) and MI & DM (51%) compared to controls (0%, P < 0.001), suggesting a potential association between the A allele and metabolic-inflammatory pathologies in diabetes and cardiovascular disease.
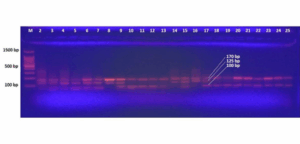
Figure 2: Representative electrophoreses the rs928508030 SNP variants within study subjects. in capturing the disparity of CTSD gene genotypes among a diverse array of samples
In this study, demographic factors such as age, sex, and body mass index did not differ significantly between the control, T2DM, and T2DM + MI groups, indicating a balanced distribution of baseline characteristics and minimizing potential confounding effects on biomarker interpretation. This consistency enhances the credibility of the observed differences in the biomarkers. Transitioning to glycemic control markers, our results revealed a significant elevation in HbA1c levels among diabetic patients, particularly those with MI, compared to healthy controls. This elevation reflects poor glycemic control, which substantially increases the risk of cardiovascular complications. A study by Yang et al. (2020) demonstrated that even among non-diabetic individuals, higher HbA1c levels were associated with an increased risk of coronary heart disease; individuals with HbA1c levels between 6.0% and 6.5% had a 90% higher risk than those with levels between 5.0% and 5.5%.18 Similarly, according to Romera et al. (2025), individuals with type 2 diabetes who had HbA1c values ≥8.5% had a considerably higher risk of myocardial infarction and stroke than those with HbA1c levels <7.0%.19 These findings underscore the role of elevated HbA1c level as a significant marker of poor glycemic management and heightened cardiovascular risk.
The current study revealed that blood adiponectin levels were significantly lower in both T2DM and T2DM with MI groups than in healthy controls, as shown in Table 1. This finding supports the concept that low adiponectin levels may contribute to the pathogenesis of diabetes and cardiovascular diseases, given the role of adiponectin in enhancing insulin sensitivity and exerting anti-inflammatory effects under normal physiological conditions. Several studies have consistently demonstrated an inverse relationship between circulating adiponectin levels and risk of developing type 2 diabetes.
A cross-sectional study by Hong et al. (2023) of 2,356 adults with metabolic comorbidities (obesity, dyslipidemia, and hypertension) found that those in the lowest tertile of adiponectin levels had a 2.3-fold higher risk of receiving a new diagnosis of type 2 diabetes than those in the highest tertile.20 Similarly, Kim et al. (2025) of 12,540 diabetic individuals found that when adiponectin levels were 32% lower, the risk of death increases by 1.8 times.21 In addition to its metabolic effects, adiponectin plays a pivotal role in cardiovascular protection. Elevated adiponectin levels have been shown to preserve vascular integrity, inhibit the progression of atherosclerosis, and reduce plaque formation. Conversely, reduced adiponectin levels contribute to endothelial dysfunction and heightened risk of MI. Recent findings by Xiang et al. (2024) demonstrated significantly lower adiponectin levels in patients with coronary artery disease than in controls.22 Furthermore, adiponectin confers cardiovascular protection by modulating inflammatory pathways and enhancing endothelial function.23
Patients with type 2 diabetes and MI exhibited significantly elevated levels of TNF-α compared to controls (Table 1). In this study, a significant negative correlation was observed between TNF-α and adiponectin levels, suggesting that increased systemic inflammation may suppress the anti-inflammatory and insulin-sensitizing effects of adiponectin. 2024 cross-sectional research of 495 diabetic patients found that TNF-α-driven inflammation reduced the insulin-sensitizing actions of adiponectin. Elevated TNF-α levels were adversely correlated with adiponectin activity (β = -0.18, P < 0.001). TNF-α alters adiponectin signaling pathways, leading to increased insulin resistance and endothelial dysfunction.24 Conversely, a positive correlation was observed between TNF-α and cathepsin D levels, implying that heightened inflammatory responses might upregulate lysosomal protease activity. Elevated CTSD levels driven by TNF-α could reflect enhanced cellular stress, apoptosis, and tissue remodeling observed in diabetic and cardiovascular pathologies.25 This relationship supports the concept that persistent inflammation in T2DM fosters cellular damage through CTSD activation while simultaneously impairing metabolic regulation via adiponectin suppression.
Serum cathepsin D levels were significantly elevated in patients with T2DM compared with those in healthy controls (Table 1). Furthermore, CTSD levels were positively correlated with both BMI and HbA1c, suggesting their potential as biomarkers of insulin resistance and metabolic dysfunction. These findings align with those of a previous study by Liu et al. (2017), who demonstrated significantly higher CTSD concentrations in T2DM patients relative than in controls. They also reported positive associations between CTSD levels and metabolic parameters such as HOMA-IR, triglycerides, fasting blood glucose, and HbA1c, reinforcing its role in metabolic disturbance.10
Additionally, Wang et al. (2020) proposed that the pro-inflammatory environment associated with T2DM and cardiovascular disease could lead to increased CTSD expression as a compensatory mechanism aimed at resolving inflammation through apoptosis of activated immune cells.26 Moreover, CTSD has been implicated in the accumulation of advanced glycation end products (AGEs), which exacerbate vascular complications in diabetic patients.27 Recent findings by Kobayashi et al (2023) further suggest that lysosomal dysfunction, a hallmark of diabetic cardiomyopathy, may result in cytoplasmic leakage of CTSD, activating apoptotic pathways in cardiomyocytes and promoting adverse cardiac remodeling and myocardial dysfunction.28 Interestingly, a moderate inverse correlation between the CTSD and adiponectin levels was observed in this study. This suggests that increased CTSD may suppress adiponectin levels, linking inflammation and metabolic derangement. Supporting this, Molvin et al. (2020) indicated that combining adiponectin and CTSD measurements could enhance the prediction of cardiovascular risk in individuals with diabetes.26
Research has demonstrated that myocardial CTSD upregulation following myocardial infarction serves a protective function against cardiac remodeling and dysfunction. This protection operates, at least partially, through promotion of myocardial autophagic flux. This suggests that CTSD plays an important role in heart response to ischemic injury.29 Recent Mendelian randomization (MR) analyses have investigated causal relationships between various CTSD and cardiovascular diseases. These studies found that CTSD increased the risk of myocardial infarction.30 Based on the available search results, there appears to be a gap in research that specifically examines the relationship between CTSD polymorphisms, myocardial infarction, and type 2 diabetes mellitus. While separate studies have established connections between CTSD and either cardiovascular conditions or diabetes, research directly investigating CTSD polymorphisms in relation to both conditions simultaneously is limited.
The study highlights the strengths of a well-structured case-control design, rigorous genotyping, and comprehensive biomarker profiling of CTSD, TNF-α, and adiponectin. The rs928508030 A allele was strongly associated with T2DM and MI along with high diagnostic accuracy, underscoring the CTSD biomarker potential. However, the limitations of this study include its modest sample size, cross-sectional design, and geographical specificity.
Future directions include longitudinal studies in larger, ethnically diverse cohorts; expanding genetic analyses to include additional CTSD SNPs and related genes; and conducting clinical trials to assess the therapeutic targeting of CTSD or its inflammatory partners.
This study revealed a significant association between CTSD rs928508030 polymorphism, elevated serum CTSD levels, and increased MI risk in patients with T2DM. The A allele of rs928508030 was exclusively prevalent in the T2DM, T2DM plus MI groups, correlating with higher CTSD, pro-inflammatory TNF-α, and reduced anti-inflammatory adiponectin levels. ROC analyses revealed high diagnostic accuracy for CTSD, adiponectin, and TNF-α in detecting MI, underscoring their combined utility as biomarkers. These findings highlight the role of CTSD in metabolic-inflammatory pathways and their potential for early MI risk stratification in diabetic populations.
7. Acknowledgments
The researcher extends sincere thanks and appreciation to all participants in this study. Special gratitude is also expressed to the College of Medicine at Al-Qadisiyah University and the Department of Clinical Chemistry for their invaluable scientific and academic supervision. The researcher further acknowledges the cooperation and support provided by Al-Zahraa Teaching Hospital in the Wasit Governorate, which played a significant role in facilitating the research procedures.
8. Data availability
The numerical data generated in this study are available from the authors.
9. Competing interests
The authors have nothing to disclose.
10. Funding
This research did not receive any specific grants from funding agencies.
11. Authors contribution
The authors contributed equally to the conceptualization of the research, collected data, and participated in data analysis and write-up, editing, and review.
Authors affiliations:
- Mohammed H. Hassan, Department of Medical Chemistry, College of Medicine, University of Al-Qadisiyah, Al-Diywaniyah, Iraq;
Email: post24.61@qu.edu.iq; {ORCID:0009-0008-8776-7189} - Ferdous A. Jabir, Department of Medical Chemistry, College of Medicine, University of Al-Qadisiyah, Al-Diywaniyah, Iraq;
Email: Ferdousabbas@gmail.com; {ORCID:0000-0001-7283-597X}
ABSTRACT
Background & objective: Type 2 diabetes mellitus (T2DM) significantly increases the risk of cardiovascular disease, including myocardial infarction (MI). Cathepsin D (CTSD), which is involved in the metabolic and inflammatory pathways, may serve as a diagnostic biomarker. This study investigated the association between the CTSD polymorphism (rs928508030) and MI in patients with T2DM, and evaluated CTSD, adiponectin, and TNF-α as diagnostic biomarkers.
Methodology: This cross-sectional study enrolled 120 participants: 40 controls, 40 T2DM patients, and 40 T2DM patients with MI. The serum levels of CTSD, adiponectin, and TNF-α were measured using ELISA. Genotyping of CTSD rs928508030 SNP was performed using tetra-ARMS PCR. Statistical analyses included ANOVA, chi-square tests, ROC curve analysis, and Pearson correlations.
Results: T2DM and MI patients exhibited significantly higher CTSD (374 ± 118 ng/L) and TNF-α (160 ± 52.8 ng/L) and lower adiponectin (9.0 ± 1.7 mg/L) levels than the controls (P < 0.001). The A allele of rs928508030 was enriched in the T2DM (54%) and T2DM and MI (51%) groups compared to the controls (0%, P < 0.001). ROC analysis demonstrated high diagnostic accuracy for CTSD (AUC=94%), adiponectin (AUC=93%), and TNF-α (AUC=93%) in MI detection. Positive correlations were found between CTSD and TNF-α (r=0.514) and HbA1c (r=0.554), whereas adiponectin was inversely correlated with metabolic inflammatory markers (P < 0.05).
Conclusion: CTSD rs928508030 A allele and elevated CTSD levels were associated with increased MI risk in T2DM patients. CTSD, along with adiponectin and TNF-α, exhibits strong diagnostic potential for MI in this population. These findings underscore the role of the genetic and inflammatory pathways in diabetic cardiovascular complications.
Abbreviations: CTSD: Cathepsin D, EDTA: Ethylene diamine tetraacetic acid, MI: myocardial infarction, T2DM: Type 2 diabetes mellitus, TNF-α: Tumor necrosis factor-alpha.
Keywords: Cathepsin D; Diabetes Mellitus; myocardial infarction; T2DM; TNF-α; adiponectin
Citation: Hassan FH, Jabir FA. Association of cathepsin D (CTSD) polymorphism and serum levels with myocardial infarction risk in type-2 diabetes mellitus. Anaesth. pain intensive care 2025;29(7):694-701. DOI: 10.35975/apic.v29i7.2944
Received: July 23, 2025; Revised: August 05, 2025; Accepted: August 09, 202
1. INTRODUCTION
Type 2 diabetes mellitus (T2DM) is a chronic metabolic disorder characterized by elevated blood glucose levels owing to insulin resistance and/or relative insulin insufficiency. Unlike type 1 diabetes, which is caused by autoimmune destruction of pancreatic β-cells, T2DM develops gradually and is frequently associated with obesity, sedentary lifestyle, and hereditary vulnerability.1 According to recent estimates, T2DM has become an epidemic that affects over 500 million people worldwide. Its prevalence is expected to continue to increase, particularly in low- and middle-income nations (International Diabetes Federation, 2019). Owing to its increasing prevalence and heavy impact on healthcare systems, this illness is a serious public health problem.2 T2DM is associated with major long-term consequences, such as cardiovascular illnesses, nephropathy, retinopathy, and neuropathy, in addition to persistent hyperglycemia.3 Myocardial infarction (MI) continues to be among the most common causes of morbidity and death among individuals with diabetes.4 T2DM is a well-known risk factor for cardiovascular illnesses, including myocardial infarction (MI). Several biochemical indicators have been linked to the development of cardiovascular problems in individuals.5 Adipocytes produce the hormone adiponectin, which has anti-inflammatory and insulin-sensitizing properties. Lower circulating levels of adiponectin have been found in individuals with T2DM, and have been associated with an increased risk of MI, suggesting a protective function in vascular homeostasis.6 In contrast, TNF-α is a proinflammatory cytokine that increases insulin resistance and endothelial dysfunction. TNF-α levels are associated with T2DM and atherosclerosis, contributing to the inflammatory cascade that causes cardiovascular diseases in patients with diabetes.7
The Cathepsin D gene (CTSD) was precisely mapped to the short arm of chromosome 11 at position 15.5 (11p15.5). The gene spans approximately 11,173 bp on the complementary strand and comprises nine exons that undergo transcriptional and post-transcriptional regulation. This genomic organization facilitates the expression of multiple protein products through alternative splicing events, which ultimately contribute to the diversity of CTSD functions in various cellular compartments.8 Recent studies have identified several single-nucleotide polymorphisms (SNPs) within the CTSD gene that may influence CTSD expression and activity. Studies examining single nucleotide polymorphisms (SNPs) at the CTSD locus may modulate enzyme function and activity. These genetic variations appear to have substantial implications in both normal physiology and pathological conditions.9,10 In addition to genetic disorders, alterations in CTSD expression and activity have been implicated in the pathogenesis of various conditions including breast cancer and cardiovascular disorders.
In the context of T2DM, elevated CTSD levels may exacerbate insulin resistance and inflammatory pathways, potentially contributing to cellular damage and increased cardiovascular risk.11–13 CTSD is a protease enzyme from the acid protease family that is largely generated in lysosomes and destroys cellular proteins. CTSD plays a critical role in several fundamental cellular processes including apoptosis, autophagy, and cellular stress response control, making it an essential component of the biological balance of the immune system.14 Despite its critical role in these cellular activities, blood levels vary dramatically in chronic diseases such as type 2 diabetes and myocardial infarction.15 Higher CTSD levels in T2DM patients may aggravate insulin resistance and inflammatory indicators such as TNF-α, leading to cellular damage and a higher risk of cardiovascular disease.10 Furthermore, other studies have found that excessive levels of CTSD may cause vascular tissue rupture and degeneration, reinforcing the link between this enzyme and myocardial infarction.16 Despite extensive research on the role of CTSD in metabolic and cardiovascular pathologies, existing studies have predominantly focused on its expression or activity in isolation, either in T2DM or MI. A notable gap persists in our understanding of the interplay between CTSD genetic polymorphisms and their dual associations with T2DM and MI.
While prior investigations have linked CTSD to insulin resistance, inflammatory pathways, and cardiovascular complications, no comprehensive studies have directly examined the diagnostic potential of CTSD polymorphisms in MI among T2DM patients. This has limited the development of targeted biomarkers for early cardiovascular risk stratification in high-risk populations.
2. METHODOLOGY
The study was conducted between December 2023 and March 2024 in the Department of Clinical Biochemistry and Chemistry at Al-Qadisiyah University, College of Medicine, on 120 individuals, including 40 patients with T2DM, 40 with T2DM plus MI, and 40 healthy controls. This study included experiments at the Al-Amin Center for Advanced Biotechnology and Research in Najaf Governorate and the Clinical Biochemistry Unit of the Laboratory Department at the Al-Zahraa Teaching Hospital. The mean age of the diabetic patients was 52.3 ± 8.2 years, while the mean age of the type 2 diabetic patients with MI was 57.4 ± 6.9 years. The control group consisted of 40 healthy, unrelated volunteers from the general population, with a mean age of 49 ± 5.8 years. Informed consent was obtained from all participants, and the study design was approved by the local ethics committee. Participants were asked to describe family and individual characteristics that increased their risk of coronary heart disease as well as their lifestyle choices. Diabetes was diagnosed by a physician, with appropriate tests confirming diabetes; patients with MI were diagnosed by a cardiologist. The exclusion criteria were: kidney disease, thyroid disease, autoimmune disease, congenital heart disease, other ischemic heart diseases such as angina pectoris and unstable angina, type 1 diabetes, and patients receiving insulin therapy.
2.1. Biochemical Analysis
Each patient had 5 mL of blood drawn from a vein and then separated into two test tubes: 2 mL with ethylene diamine tetraacetic acid (EDTA) for genetic study and 3 mL with a gel tube for biochemical analysis. The blood samples in the gel tubes were centrifuged at 3000-x g for ten minutes to obtain the serum. The serum was stored at -20°C until used.17 Serum levels of adiponectin: Catalog no. [E1550Hu], lot no. [202410010]; cathepsin D: catalog no. [E4668Hu], lot no. [202410010], and TNF-α: Catalog No. [E0082Hu], lot no. [202410010] were measured using enzyme-linked immunosorbent assay (ELISA) kits. All assays were performed in the laboratory of Al-Zahraa Teaching Hospital in Kut, according to the manufacturer's protocol.
2.2. DNA Extraction
The genotyping of the CTSD gene polymorphism was performed using the tetra amplification-refractory mutation system (TETRA-ARMS) technology and a specific set of primers. Genomic DNA was extracted from fresh human blood samples using the Wizard® Genomic DNA Purification Kit (Promega Corporation, USA; Cat. Nos. A1120, A1123, A1125, A1620; Lot No. 0000699929) following the manufacturer’s protocol.
Tetra-ARM PCR was used to determine the genotype of CTSD. Four primers were designed (Forward Outer, Forward Inner, Reverse Inner, and Reverse Outer). The CTSD gene, specifically targeting the G/A SNP (rs928508030), utilized a nested primer system for amplification, and the outer primers included the forward primer and reverse primer, generating a 170 bp product. Allele-specific inner primers included the forward primer (targeting the G allele) and reverse primer (targeting the A allele), which share sequence identity with the outer forward primer, but produce distinct smaller amplicons of 125 bp (G allele) and 100 bp (A allele) through nested PCR
2.3. Statistical analysis
Statistical analyses of the demographic and clinical characteristics of the individuals diagnosed with MI and DM were performed using GraphPad Prism® (version 9.3.1). Categorical variables were evaluated using the chi-square test. For datasets comprising more than two groups, one-way analysis of variance (ANOVA) was implemented, followed by Tukey’s post-hoc test for specific pairwise comparisons. Linear relationships between variables were examined using Pearson’s correlation coefficient. A significance level of P < 0.05 was applied to all statistical inferences. Data are expressed as mean ± standard deviation (SD) for normally distributed continuous variables, or as frequencies and percentages for categorical measures, consistent with their respective data types and distributional properties.
3. RESULTS
Table 1 summarizes the baseline demographic and clinical characteristics of the study cohort, including age, sex distribution, body mass index (BMI), and metabolic/inflammatory biomarkers (e.g., HbA1c, adiponectin, cathepsin, and TNF-α). Significant intergroup differences (one-way ANOVA, P < 0.001) were observed in glycemic markers (HbA1c), insulin resistance, and inflammatory mediators (TNF-α), with MI and DM participants exhibiting the highest values. Post hoc analysis revealed distinct subgroup differences (denoted by superscripts A, B, and C).
| Table 1: Demographic, metabolic, and inflammatory biomarker profiles of study participants | |||||
| Variables | Control
n = 40 |
DM
n = 40 |
MI + DM
n = 40 |
p | |
| Age (years) | 49 ± 5.8 | 52.3 ± 8.2 | 57.4 ± 6.9 | 0.16 O NS | |
| Gender |
· Female | 15 (37) | 16 (40) | 22 (55) | 0.2 CNS |
| · Male | 25 (63) | 24 (60) | 18 (45) | ||
| BMI (kg/m²) | 25.3 ± 3.1 | 28.4 ± 0.84 | 28.9 ± 1.54 | 0.16 O NS | |
| HbA1c (%) | 5.1 ± 0.4A | 8.2 ± 2.0B | 9.1 ± 2.3C | <0.001 O *** | |
| Adiponectin (mg/L) | 13.8 ± 4.7A | 11.4 ± 3.2B | 9.0 ± 1.7C | <0.001 O *** | |
| Cathepsin (ng/L) | 233.6 ± 55.8A | 291 ± 41.6B | 374 ± 118C | <0.001 O *** | |
| TNF-α (ng/L) | 98.8 ± 31.4A | 126 ± 62B | 160 ± 52.8C | <0.001 O *** | |
| C: Chi-square test; O: one-way ANOVA; ***: significant at P < 0.001. Statistical analysis was
performed using one-way ANOVA variance with post-hoc Tukey’s test for pairwise comparisons (denoted by superscript letters A, B, and C; different letters indicate significant intergroup differences). |
|||||
Figure 1: The different charts for Correlation between variables
This study evaluated the diagnostic performance of adiponectin, cathepsin, and TNF-α levels in patients with MI. All biomarkers showed high diagnostic accuracy, with AUC values ≥93%. Adiponectin showed the highest sensitivity and specificity, while TNF-α had the highest sensitivity, and cathepsin balanced sensitivity and specificity.
| Table 2: ROC curve analysis for diagnostic biomarkers in myocardial infarction group. | |||||||||
| Variables | Cut-off value | Sens*% | Spec% | PPV* | NPV | Accuracy | AUC% | P-value (AUC= 0.05) | |
| Adiponectin (mg/l) | ≤ 10.46 | 95 | 90 | 90 | 95 | 85 | 93 | <0.0001** | |
| Cathepsin (ng/L) | > 258.6 | 88 | 88 | 88 | 88 | 75 | 94 | <0.0001** | |
| Tumor necrosis factor-α (ng/L) | > 122.3 | 92 | 80 | 82 | 91 | 72 | 93 | <0.0001** | |
| Sens: Sensitivity; Spec: Specificity; PPV: positive predictive value; NPV: negative predictive value; accuracy [(Sensitivity + Specificity) - 1]; AUC: area under the curve | |||||||||
Pearson’s correlations among metabolic and inflammatory biomarkers revealed significant interrelationships (all P < 0.05). Cathepsin was correlated with TNF-α (r=0.514) and aligned with shared inflammatory pathways. Adiponectin is inversely associated with inflammatory mediators (e.g., r=−0.508 with TNF-α). Table 3 details the genotype (GG, GA, AA) and allele (G, A) frequencies of the CTSD rs928508030 SNP across control, DM, and MI & DM cohorts.
| Table 3: Genotype and allele frequencies of the CTSD rs928508030 polymorphism across study groups. | ||||||
| CTSD | Control
(n = 40) |
DM
(n = 40) |
MI & DM
(n = 40) |
X2 | P-Value | |
| CTSD | GG | 40 (100) | 13 (32) | 11 (27) | 31.6 | < 0.001*** |
| GA | 0 (0) | 16 (40) | 20 (50) | |||
| AA | 0 (0) | 11 (28) | 9 (23) | |||
| Allele | G | 80 (100) | 37 (46) | 39 (49) | 34.8 | < 0.001*** |
| A | 0 (0) | 43 (54) | 41 (51) | |||
| Chi-square, N: Number, Fr: frequency, ***: significant at P < 0.001. | ||||||
Genotype distributions and allele frequencies were analyzed using chi-square tests. The GG genotype was predominant in controls (100%), while GA and AA genotypes were significantly enriched in DM (40% GA, 28% AA) and MI & DM (50% GA, 23% AA) groups (P < 0.001). Similarly, the A allele frequency was markedly higher in DM (54%) and MI & DM (51%) compared to controls (0%, P < 0.001), suggesting a potential association between the A allele and metabolic-inflammatory pathologies in diabetes and cardiovascular disease.
Figure 2: Representative electrophoreses the rs928508030 SNP variants within study subjects. in capturing the disparity of CTSD gene genotypes among a diverse array of samples
4. DISCUSSION
In this study, demographic factors such as age, sex, and body mass index did not differ significantly between the control, T2DM, and T2DM + MI groups, indicating a balanced distribution of baseline characteristics and minimizing potential confounding effects on biomarker interpretation. This consistency enhances the credibility of the observed differences in the biomarkers. Transitioning to glycemic control markers, our results revealed a significant elevation in HbA1c levels among diabetic patients, particularly those with MI, compared to healthy controls. This elevation reflects poor glycemic control, which substantially increases the risk of cardiovascular complications. A study by Yang et al. (2020) demonstrated that even among non-diabetic individuals, higher HbA1c levels were associated with an increased risk of coronary heart disease; individuals with HbA1c levels between 6.0% and 6.5% had a 90% higher risk than those with levels between 5.0% and 5.5%.18 Similarly, according to Romera et al. (2025), individuals with type 2 diabetes who had HbA1c values ≥8.5% had a considerably higher risk of myocardial infarction and stroke than those with HbA1c levels <7.0%.19 These findings underscore the role of elevated HbA1c level as a significant marker of poor glycemic management and heightened cardiovascular risk.
The current study revealed that blood adiponectin levels were significantly lower in both T2DM and T2DM with MI groups than in healthy controls, as shown in Table 1. This finding supports the concept that low adiponectin levels may contribute to the pathogenesis of diabetes and cardiovascular diseases, given the role of adiponectin in enhancing insulin sensitivity and exerting anti-inflammatory effects under normal physiological conditions. Several studies have consistently demonstrated an inverse relationship between circulating adiponectin levels and risk of developing type 2 diabetes.
A cross-sectional study by Hong et al. (2023) of 2,356 adults with metabolic comorbidities (obesity, dyslipidemia, and hypertension) found that those in the lowest tertile of adiponectin levels had a 2.3-fold higher risk of receiving a new diagnosis of type 2 diabetes than those in the highest tertile.20 Similarly, Kim et al. (2025) of 12,540 diabetic individuals found that when adiponectin levels were 32% lower, the risk of death increases by 1.8 times.21 In addition to its metabolic effects, adiponectin plays a pivotal role in cardiovascular protection. Elevated adiponectin levels have been shown to preserve vascular integrity, inhibit the progression of atherosclerosis, and reduce plaque formation. Conversely, reduced adiponectin levels contribute to endothelial dysfunction and heightened risk of MI. Recent findings by Xiang et al. (2024) demonstrated significantly lower adiponectin levels in patients with coronary artery disease than in controls.22 Furthermore, adiponectin confers cardiovascular protection by modulating inflammatory pathways and enhancing endothelial function.23
Patients with type 2 diabetes and MI exhibited significantly elevated levels of TNF-α compared to controls (Table 1). In this study, a significant negative correlation was observed between TNF-α and adiponectin levels, suggesting that increased systemic inflammation may suppress the anti-inflammatory and insulin-sensitizing effects of adiponectin. 2024 cross-sectional research of 495 diabetic patients found that TNF-α-driven inflammation reduced the insulin-sensitizing actions of adiponectin. Elevated TNF-α levels were adversely correlated with adiponectin activity (β = -0.18, P < 0.001). TNF-α alters adiponectin signaling pathways, leading to increased insulin resistance and endothelial dysfunction.24 Conversely, a positive correlation was observed between TNF-α and cathepsin D levels, implying that heightened inflammatory responses might upregulate lysosomal protease activity. Elevated CTSD levels driven by TNF-α could reflect enhanced cellular stress, apoptosis, and tissue remodeling observed in diabetic and cardiovascular pathologies.25 This relationship supports the concept that persistent inflammation in T2DM fosters cellular damage through CTSD activation while simultaneously impairing metabolic regulation via adiponectin suppression.
Serum cathepsin D levels were significantly elevated in patients with T2DM compared with those in healthy controls (Table 1). Furthermore, CTSD levels were positively correlated with both BMI and HbA1c, suggesting their potential as biomarkers of insulin resistance and metabolic dysfunction. These findings align with those of a previous study by Liu et al. (2017), who demonstrated significantly higher CTSD concentrations in T2DM patients relative than in controls. They also reported positive associations between CTSD levels and metabolic parameters such as HOMA-IR, triglycerides, fasting blood glucose, and HbA1c, reinforcing its role in metabolic disturbance.10
Additionally, Wang et al. (2020) proposed that the pro-inflammatory environment associated with T2DM and cardiovascular disease could lead to increased CTSD expression as a compensatory mechanism aimed at resolving inflammation through apoptosis of activated immune cells.26 Moreover, CTSD has been implicated in the accumulation of advanced glycation end products (AGEs), which exacerbate vascular complications in diabetic patients.27 Recent findings by Kobayashi et al (2023) further suggest that lysosomal dysfunction, a hallmark of diabetic cardiomyopathy, may result in cytoplasmic leakage of CTSD, activating apoptotic pathways in cardiomyocytes and promoting adverse cardiac remodeling and myocardial dysfunction.28 Interestingly, a moderate inverse correlation between the CTSD and adiponectin levels was observed in this study. This suggests that increased CTSD may suppress adiponectin levels, linking inflammation and metabolic derangement. Supporting this, Molvin et al. (2020) indicated that combining adiponectin and CTSD measurements could enhance the prediction of cardiovascular risk in individuals with diabetes.26
Research has demonstrated that myocardial CTSD upregulation following myocardial infarction serves a protective function against cardiac remodeling and dysfunction. This protection operates, at least partially, through promotion of myocardial autophagic flux. This suggests that CTSD plays an important role in heart response to ischemic injury.29 Recent Mendelian randomization (MR) analyses have investigated causal relationships between various CTSD and cardiovascular diseases. These studies found that CTSD increased the risk of myocardial infarction.30 Based on the available search results, there appears to be a gap in research that specifically examines the relationship between CTSD polymorphisms, myocardial infarction, and type 2 diabetes mellitus. While separate studies have established connections between CTSD and either cardiovascular conditions or diabetes, research directly investigating CTSD polymorphisms in relation to both conditions simultaneously is limited.
5. Strengths and Limitations
The study highlights the strengths of a well-structured case-control design, rigorous genotyping, and comprehensive biomarker profiling of CTSD, TNF-α, and adiponectin. The rs928508030 A allele was strongly associated with T2DM and MI along with high diagnostic accuracy, underscoring the CTSD biomarker potential. However, the limitations of this study include its modest sample size, cross-sectional design, and geographical specificity.
Future directions include longitudinal studies in larger, ethnically diverse cohorts; expanding genetic analyses to include additional CTSD SNPs and related genes; and conducting clinical trials to assess the therapeutic targeting of CTSD or its inflammatory partners.
6. CONCLUSION
This study revealed a significant association between CTSD rs928508030 polymorphism, elevated serum CTSD levels, and increased MI risk in patients with T2DM. The A allele of rs928508030 was exclusively prevalent in the T2DM, T2DM plus MI groups, correlating with higher CTSD, pro-inflammatory TNF-α, and reduced anti-inflammatory adiponectin levels. ROC analyses revealed high diagnostic accuracy for CTSD, adiponectin, and TNF-α in detecting MI, underscoring their combined utility as biomarkers. These findings highlight the role of CTSD in metabolic-inflammatory pathways and their potential for early MI risk stratification in diabetic populations.
7. Acknowledgments
The researcher extends sincere thanks and appreciation to all participants in this study. Special gratitude is also expressed to the College of Medicine at Al-Qadisiyah University and the Department of Clinical Chemistry for their invaluable scientific and academic supervision. The researcher further acknowledges the cooperation and support provided by Al-Zahraa Teaching Hospital in the Wasit Governorate, which played a significant role in facilitating the research procedures.
8. Data availability
The numerical data generated in this study are available from the authors.
9. Competing interests
The authors have nothing to disclose.
10. Funding
This research did not receive any specific grants from funding agencies.
11. Authors contribution
The authors contributed equally to the conceptualization of the research, collected data, and participated in data analysis and write-up, editing, and review.
12. REFERENCES
- American Diabetes Association. Standards of medical care in diabetes-2019. Diabetes Care. 2019;42(Suppl 1):S13-S28. [PubMed] DOI: 2337/dc19-S002
- Khan MAB, Hashim MJ, King JK, Govender RD, Mustafa H, Al Kaabi J. Epidemiology of type 2 diabetes—global burden of disease and forecasted trends. J Epidemiol Glob Health. 2020;10(1):107-11. [PubMed] DOI: 2991/jegh.k.191028.001
- Iatcu CO, Steen A, Covasa M. Gut microbiota and complications of type-2 diabetes. Nutrients. 2021;14(1):166. [PubMed] DOI: 3390/nu14010166
- Rydén L, Grant PJ, Anker SD, Berne C, Cosentino F, Danchin N, et al. ESC guidelines on diabetes, pre-diabetes, and cardiovascular diseases developed in collaboration with the EASD-summary. Diab Vasc Dis Res. 2014;11(3):133-73. [PubMed] DOI: 1177/1479164114525548
- Cui J, Liu Y, Li Y, Xu F, Liu Y. Type 2 diabetes and myocardial infarction: recent clinical evidence and perspective. Front Cardiovasc Med. 2021;8:644189. [PubMed] DOI: 3389/fcvm.2021.644189
- Lindberg S, Jensen JS, Pedersen SH, Galatius S, Frystyk J, Flyvbjerg A, et al. Low adiponectin levels and increased risk of type 2 diabetes in patients with myocardial infarction. Diabetes Care. 2014;37(11):3003-8. [PubMed] DOI: 2337/dc14-0932
- Wei X, Che W, Wang Q, Yu L. Evaluation of adiponectin and TNF-α expression in diabetic patients and its relationship with cardiovascular diseases. Cell Mol Biol. 2023;69(5):75-9. [PubMed] DOI: 14715/cmb/2023.69.5.13
- Huber RJ, Kim WD, Wilson‐Smillie MLDM. Mechanisms regulating the intracellular trafficking and release of CLN5 and CTSD. Traffic. 2024;25(3):e12925. [PubMed] DOI: 1111/tra.12925
- Ding L, De Munck TJI, Oligschlaeger Y, Verbeek J, Koek GH, Houben T, et al. Insulin resistance is positively associated with plasma cathepsin D activity in NAFLD patients. Biomol Concepts. 2021;12(1):110-5. [PubMed] DOI: 1515/bmc-2021-0011
- Liu L, Chen B, Zhang X, Tan L, Wang DW. Increased cathepsin D correlates with clinical parameters in newly diagnosed type 2 diabetes. Dis Markers. 2017;2017:5286408. [PubMed] DOI: 1155/2017/5286408
- Kang J, Yu Y, Jeong S, Lee H, Heo HJ, Park JJ, et al. Prognostic role of high cathepsin D expression in breast cancer: a systematic review and meta-analysis. Ther Adv Med Oncol. 2020;12:1758835920927838. [PubMed] DOI: 1177/1758835920927838
- Hossain MI, Marcus JM, Lee JH, Garcia PL, Singh V, Shacka JJ, et al. Restoration of CTSD (cathepsin D) and lysosomal function in stroke is neuroprotective. Autophagy. 2021;17(6):1330-48. [PubMed] DOI: 1080/15548627.2020.1761219
- Liu CL, Guo J, Zhang X, Sukhova GK, Libby P, Shi GP. Cysteine protease cathepsins in cardiovascular disease: from basic research to clinical trials. Nat Rev Cardiol. 2018;15(6):351-70. [PubMed] DOI: 1038/s41569-018-0002-3
- Di YQ, Han XL, Kang XL, Wang D, Chen CH, Wang JX, et al. Autophagy triggers CTSD (cathepsin D) maturation and localization inside cells to promote apoptosis. Autophagy. 2021;17(5):1170-92. [PubMed] DOI: 1080/15548627.2020.1752497
- Yadati T, Houben T, Bitorina A, Shiri-Sverdlov R. The ins and outs of cathepsins: physiological function and role in disease management. Cells. 2020;9(7):1679. [PubMed] DOI: 3390/cells9071679
- He X, Tian S, Bu L, Zhao X, Zheng L, Zhang P, et al. Cathepsin D inhibits AGEs-induced phenotypic transformation in vascular smooth muscle cells. Sci Rep. 2025;15(1):11502. [PubMed] DOI: 1038/s41598-025-96038-y
- Börsch-Supan M, Andersen-Ranberg K, Borbye-Lorenzen N, et al. Biomarkers in SHARE: Documentation of Implementation, Collection, and Analysis of Dried Blood Spot (DBS) Samples 2015–2023. National Bureau of Economic Research; 2024. DOI: 3386/w32764
- Yang J, Zhou Y, Zhang T, Lin X, Ma X, Wang Z, et al. Fasting blood glucose and HbA1c correlate with severity of coronary artery disease in elective PCI patients with HbA1c 5.7% to 6.4%. Angiology. 2020;71(2):167-74. [PubMed] DOI: 1177/0003319719887655
- Romera IC, Redondo-Antón J, Rubio-de Santos M, Díaz-Cerezo S, Artime E, Rafels-Ybern A, et al. The Association Between HbA1c Levels and the Risk of Myocardial Infarction and Stroke in People with Type 2 Diabetes: A Post Hoc Analysis of the REPRESENT Study. Diabetes Ther. 2025;16(6):1229-39. [PubMed] DOI: 1007/s13300-025-01727-6
- Hong X, Zhang X, You L, Li F, Lian H, Wang J, et al. Association between adiponectin and newly diagnosed type 2 diabetes in population with the clustering of obesity, dyslipidaemia and hypertension: a cross-sectional study. BMJ Open. 2023;13(3):e060377. [PubMed] DOI: 1136/bmjopen-2021-060377
- Kim M-J, Kim S-W, Ha B, et al. Persistent influence of past obesity on current adiponectin levels and mortality in patients with type 2 diabetes. Korean J Intern Med. 2025;40(2):299-.[PubMed]
- Xiang X, Wang D, Leng J, et al. Association of adiponectin and its receptor gene polymorphisms with the risk of coronary heart disease in northern Guangxi. Cytokine. 2024;178:156567. [PubMed]
- Lei X, Qiu S, Yang G, et al. Adiponectin and metabolic cardiovascular diseases: Therapeutic opportunities and challenges. Genes Dis. 2023;10(4):1525-36. [PubMed]
- Xia Z, Shi S, Ma X, et al. Mediating effect of adiponectin between free fatty acid and tumor necrosis factor-α in patients with diabetes. Nutr Diabetes. 2024;14(1):45. [PubMed]
- Ding L, Goossens GH, Oligschlaeger Y, et al. Plasma cathepsin D activity is negatively associated with hepatic insulin sensitivity in overweight and obese humans. Diabetologia. 2020;63(2):374-84. [PubMed]
- Molvin J, Jujić A, Melander O, et al. Proteomic exploration of common pathophysiological pathways in diabetes and cardiovascular disease. ESC Heart Fail. 2020;7(6):4151-8. [PubMed]
- Twarda-Clapa A, Olczak A, Białkowska AM, et al. Advanced glycation end-products (AGEs): Formation, chemistry, classification, receptors, and diseases related to AGEs. Cells. 2022;11(8):1312. [PubMed]
- Kobayashi S, Hahn Y, Silverstein B, et al. Lysosomal dysfunction in diabetic cardiomyopathy. Front Aging. 2023;4:1113200. [PubMed]
- Wu P, Yuan X, Li F, et al. Myocardial Upregulation of Cathepsin D by Ischemic Heart Disease Promotes Autophagic Flux and Protects Against Cardiac Remodeling and Heart Failure. Circ Heart Fail. 2017;10(7):e004044. [PubMed]
- Li Q, Zhou Z, Xu T, et al. Relationship between cathepsins and cardiovascular diseases: a Mendelian randomized study. Front Pharmacol. 2024;15:1370350. [PubMed]