Zeena Hussien Khudair 1 , Abeer Cheaid Yousif 2 , Ahmed Qasim Jaafar 3
Authors affiliations:
Background & objective: Atherosclerosis (AS) is a chronic inflammatory disease characterized by the accumulation of lipids, cholesterol, and other substances on the arterial walls. This leads to plaque formation, which can narrow and harden the arteries, leading to reduced blood flow. We aimed to study the association between sub-clinical/ clinical AS and serum levels of Midkine (MK) in patients.
Materials and Methods: This cross-sectional study included 90 male participants aged 20-60 years (mean age 33.00 ± 6.131 years). Participants were divided into two groups: 45 patients with clinical coronary AS (mean age 34.50 ± 4.949 years) and 45 patients with subclinical coronary AS (mean age 32.25 ± 7.228 years). The serum Midkine, insulin, and fasting blood glucose were calculated using an Enzyme-Linked Immunosorbent Assay (ELISA), whereas HbA1C measurement was conducted by a spectrophotometer.
Results: The results demonstrated a highly significant elevation (P ≤ 0.01) in Midkine levels among patients with clinical AS (2.728 ± 0.411) compared to those with subclinical AS (1.056 ± 0.160). Additionally, patients with clinical AS exhibited significantly higher levels (P ≤ 0.01) of multiple metabolic parameters compared to the subclinical group, including random glucose, insulin, and HbA1C. Lipid profile analysis revealed significant increases (P ≤ 0.01) in total cholesterol (TC), triglycerides (TG), low-density lipoprotein (LDL), and very low-density lipoprotein (VLDL) in the clinical AS group relative to the subclinical AS group.
Conclusion: This study highlighted a significant link between elevated serum MK levels and atherosclerosis risk factors, including diabetes mellitus and increased total and LDL cholesterol. C-peptide, insulin, HOMA-IR can be regarded as the main indicators of diabetic mellitus markers. Therefore, MK can be considered early diagnosis and prognosis biomarker for atherosclerosis.
Abbreviations: AS: Atherosclerosis, DM: Diabetes mellitus, LDL: low-density lipoprotein, MK: Midkine, TC: total cholesterol, TG: triglycerides, VLDL: very low-density lipoprotein, HOMA-IR: Homeostatic Model Assessment of Insulin Resistance
Keywords: Cholesterol; Coronary Atherosclerosis; Diabetes Mellitus; HOMA-IR; HbA1C; Lipoprotein; Midkine; Triglycerides
Citation: Khudair ZH, Yousif AC, Jaafar AQ. Midkine (MK) as a novel biomarker of clinical-subclinical coronary atherosclerosis and related to diabetes mellitus: clinical applications. Anaesth. pain intensive care 2025;29(6):559-566. DOI: 10.35975/apic.v29i6.2915
Received: June 10, 2025; Revised: Jul 16, 2024; Accepted: Jul 24, 2025
Atherosclerosis (AS) is a chronic and progressive disease characterized by the thickening and hardening of arterial walls due to the accumulation of lipids, inflammatory cells, and fibrous elements.1,2 Subclinical AS refers to the early stages of AS in which structural changes occur in the blood vessels without causing noticeable symptoms. At this stage, fatty deposits (plaques) begin to accumulate in the arterial walls, but they have not yet caused significant narrowing or blockage that would lead to clinical signs like chest pain (angina), heart attack, or stroke.3,4
Clinical AS refers to the symptomatic and advanced stage of AS, in which the buildup of fatty plaques inside the arteries has progressed enough to cause measurable blood flow restriction and lead to clinical events or symptoms.5
The pathogenesis of AS involves multiple stages, including endothelial dysfunction, lipid accumulation, inflammatory response, and plaque formation, which can lead to plaque instability and rupture.6,7
Diabetes mellitus (DM) is a chronic metabolic disorder characterized by persistent hyperglycemia due to defects in insulin secretion, insulin action, or both. The main types include Type 1, Type 2, and gestational diabetes, with risk factors such as genetic predisposition, obesity, age, and lifestyle choices contributing to its rising incidence.8,9
Diabetes accelerates AS through multiple mechanisms: endothelial dysfunction, dyslipidemia, inflammation, and a pro-thrombotic state. This makes cardiovascular disease (CVD) the leading cause of death in people with diabetes.10,11
Midkine (MK) is a heparin-binding growth factor that plays a significant role in the pathogenesis of AS, a chronic inflammatory disease characterized by the accumulation of lipids and fibrous elements in the large arteries. MK is involved in various biological processes, including inflammation, angiogenesis, and cell survival, which are critical in the development and progression of atherosclerotic plaques.12,13
Midkine contributes to AS through its pro-inflammatory, pro-angiogenic, and anti-apoptotic effects, as well as by promoting lipid accumulation in macrophages. Its elevated levels in various cardiovascular conditions highlight its potential as both a biomarker and a therapeutic target in atherosclerotic disease.12
The study aims to investigate Midkine levels and assess their association with diabetes mellitus in patients with both subclinical and clinical AS.
A cross-sectional study of 90 males with a range of ages 20 ≥ 60 years, mean age of 33.00 years, were enrolled in the present study, divided into 45 patients with clinical coronary AS, with a mean age of (34.500 ± 4.949), and 45 patients with sub-clinical coronary AS, with a mean age of 32.250 ± 7.228. The study was conducted to evaluate the clinical and sub-clinical coronary AS males related to type 2 diabetes in Karbala, Iraq. Diabetes can be classified into three main categories: non-diabetes (normal), prediabetes, and diabetes.14 The data were collected and recorded from September 2024 to December 2024 at the Imam Hussein Karbala Center for Heart Diseases and Surgery Teaching Hospital. Diseases were diagnosed through laboratory tests, monitoring some clinical symptoms, and all patients were diagnosed by conventional coronary angiography or CT scan by a cardiologist. Moreover, information for each group was collected according to the questionnaire. The exclusion criteria of this study were: female gender, patients with a history of an endocrine disease, cancers, liver disease, nephropathy, and alcohol intake. The inclusion criteria were: male patients with clinical or sub-clinical coronary AS.
Five milliliters of venous blood samples were obtained from each fasting patient via venepuncture with a sterile syringe. All samples were identified by their specific numbers (ID) generated by the laboratory information system. Blood (2 mL) was placed in the EDTA tube (ethylene diamine tetraacetic acid) to prevent clotting of blood for hematological parameters to measure HbA1C. For fasting blood glucose, 3 mL of blood was placed in the plain tube and allowed to clot (to get the serum), and then centrifuged at 4000 rpm for ten minutes.
Serum insulin levels were measured using an insulin kit (Elabsciences, Wuhan, China) employing the Sandwich-ELISA method. HbA1c was measured using an automated chemistry analyzer (Cobas Integra 400 plus) with a kit from OSN, Korea. Lipid profile was assessed using a kit from Linear Chemicals S.L, Spain, measured by the enzymatic colorimetric technique. Homeostatic Model Assessment of Insulin Resistance (HOMA-IR) was calculated using the following formula:
(HOMA‑IR = fasting plasma insulin (µU/ml) × fasting plasma glucose (mg/dl)/405)(9).
Midkine (MK) kit
Samples were allowed to clot for 1 hour at room temperature or overnight at 2-8℃ before centrifugation for 20 min at 1000×g at 2-8℃. The supernatant was collected to carry out the assay.
The (Elabsciences, Wuhana,China) kit is based on the Sandwich ELISA method. The microplate included in the kit is pre-coated with an antibody that specifically targets human midkine (MK). When samples or standards are added to the wells, they bind to the immobilized antibody, allowing for the detection of MK through this specific interaction.
2.1. Sample size determination
In order to determine an appropriate and statistically valid sample size for this cross-sectional study, the finite population correction (FPC) method was applied. This approach is particularly suitable when the total population is known and not extremely large (typically under a few million), as is the case in this study. The target population is the general population of Karbala city, which has an estimated population of 800,000 individuals. The sample size calculation was based on the following formula according to Cochran.19
2.2. Statistical Analysis
Data analysis was conducted statistically by employing SPSS statistical packages version 23. The analysis results were summarized using descriptive statistics. In addition, mean and standard deviation were calculated, and to assess the statistical significance of the experimental results, a p-value threshold of 0.05 probability threshold was utilized. Furthermore, the normality of the data was verified using the Shapiro-Wilk test, while the homogeneity of variance was examined with the Levene test. Nevertheless, to investigate the association between categorical and numerical variables, chi-square and Pearson's correlation analyses were conducted. Statistical differences for two independent groups were determined using the Mann-Whitney Test and the Independent T-Test. Besides, multiple comparisons between groups were performed using analysis of variance (ANOVA), followed by Scheffe's post-hoc tests for multiple comparisons within groups. Moreover, to find out the cut-off points of the research parameters for critical patients, receiver operating characteristic (ROC) analyses were administered. AUC was used for prediction strength, and optimum cut-off points were chosen using Youden’s index. An asterisk indicates data with a P < 0.01.
The results showed a significant increase in the random glucose, insulin, HOMA IR, HbA1C, C-peptide, and midkine in sub-clinical AS patients (P < 0.05). Meanwhile, the level of fasting plasma glucose in clinical AS showed a non-significant increase compared to sub-clinical AS patients (P = 0.21457).
The results showed a significant (P ≤ 0.01) increase in cholesterol, triglyceride, low-density lipoprotein (LDL), and very low-density lipoprotein (VLDL) levels in sub-clinical AS group. However, there was a significant decrease in the level of high-density lipoprotein in clinical AS patients as compared to sub-clinical AS patients (P = 0.00002) (Table 2).
The results revealed a significant decrease in MK level (P ≤ 0.01) in the subclinical AS group, regardless of the age groups, family history, smoking status, and area (Table 3).
He results showed a significant decrease in cholesterol, triglycerides, low-density lipoprotein, and very low-density lipoprotein (p ≤ 0.01) in subclinical AS patients across non-diabetic, pre-diabetic, and diabetic groups. On the other hand, the results showed a significant increase in HDL cholesterol (P ≤ 0.01) in subclinical AS patients across non-diabetic, pre-diabetic, and diabetic groups. However, the values for the AS patients were (47.025 ± 6.061), (42.266 ± 9.687), and (39.619 ± 8.688), respectively (Table 4).
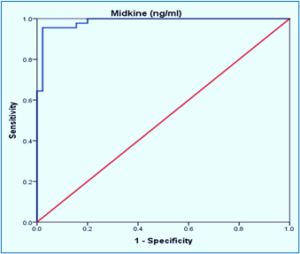
Figure 1: ROC curve analysis of Midkine predictive accuracy for AS detection.
The results demonstrated a significant decrease (P ≤ 0.01) in random glucose and c-peptide in non-diabetic, pre-diabetic and diabetic. Also, the decrease was shown in insulin, HOMA-IR, e NOS, and Mdkine in diabetics in sub-clinical AS patients as in Table 5.
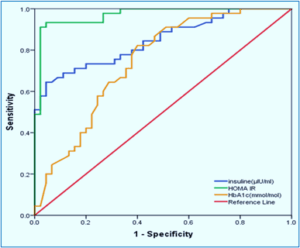
Figure 2: ROC curve analysis of glucose parameters predictive accuracy for AS detection
Table 6 shows the cutoff points, AUC with sensitivities, specificities, and accuracies of the biomarkers.
The levels of fasting glucose, HbA1c, HOMA-IR, and insulin in clinical AS were elevated compared to subclinical AS. This is primarily because increased insulin resistance, chronic hyperglycemia, and insulin resistance impair glucose uptake, leading to higher blood glucose levels. This metabolic dysfunction is more pronounced in clinical AS, where systemic inflammation and endothelial dysfunction further exacerbate glycemic control. These factors collectively contribute to the progression from subclinical to clinical AS.15
Elevated lipid profiles (excluding HDL) are more pronounced in clinical AS because the disease is more advanced, with longer and more intense exposure to atherogenic lipids like LDL and triglycerides. In clinical AS, HDL levels are lower because chronic inflammation, oxidative stress, and metabolic issues like insulin resistance disrupt HDL production and function. These factors make HDL less effective and reduce its levels, especially alongside high triglycerides and enzyme imbalances, leading to decreased protective effects compared to earlier, subclinical stages.16-18 Clinical stages involve greater inflammation, metabolic disruption, and more harmful lipid particle types, often alongside comorbidities like diabetes or obesity. These factors contribute to higher lipid levels compared to subclinical (early, asymptomatic) AS.19,20
Several studies align with the current findings, demonstrating that increased insulin resistance, elevated glucose parameters, higher LDL and triglycerides, and reduced HDL are significantly associated with the progression from subclinical to clinical AS.21,22
MK levels are elevated in aging, smoking, and diabetes in the clinical AS group due to their association with chronic inflammation and tissue injury. MK's role in these processes highlights its potential as a biomarker for monitoring disease progression and therapeutic interventions.2,23,24
In patients with AS, glucose parameters are notably higher in those with diabetes and prediabetes, compared to nondiabetic individuals, due to several interrelated mechanisms. These include insulin resistance prevalent in prediabetics and diabetics, which leads to elevated blood glucose levels. This contributes to vascular dysfunction. Studies indicate that individuals with prediabetes exhibit a greater atherosclerotic burden than their nondiabetic counterparts, with significant increases in coronary artery plaque and stenosis severity.25,26
Diabetic dyslipidemia, often referred to as atherogenic dyslipidemia, is characterized by elevated levels of cholesterol and triglycerides, along with reduced HDL levels. To further investigate this association, the researchers of the current study examined the link between diabetes—another condition commonly linked to the development of AS—and lipid abnormalities.27,28
An increase in low-density lipoprotein (LDL) and a decrease in high-density lipoprotein (HDL) are significant risk factors for CVD, primarily due to endothelial dysfunction, coagulation abnormalities, and metabolic, hormonal, and hemodynamic changes associated with an altered lipid profile.29,30
The study was conducted with a small sample size and at a single center. Although other studies have shown almost similar results, we recommend a multi-center study at a larger scale to achieve definitive numerical results.
This study concludes that serum levels of Midkine, insulin, HOMA-IR, HbA1c, and C-peptide are significantly elevated in patients with clinical AS compared to those with subclinical AS. Among these biomarkers, Midkine demonstrated the highest diagnostic accuracy, suggesting its effectiveness as a predictive biomarker for the early detection and diagnosis of AS in cardiovascular disease.
7. Data availability
The numerical data generated during this research are available from the authors.
8. Conflict of interest
All authors declare that there was no conflict of interest.
9. Funding
The study utilized the hospital resources only, and no external or industry funding was involved.
10. Authors’ contribution
All authors took an equal part in the conduct of the study and manuscript preparation.
Authors affiliations:
- Zeena Hussien Khudair, Department of Clinical Laboratories, College of Applied Medical Science, University of Karbala, Karbala, Iraq; Email: zeenahussien@yahoo.com
- Abeer Cheaid Yousif, Department of Clinical Laboratories, College of Applied Medical Science, University of Karbala, Karbala, Iraq; Email: Abeercheaid44@yahoo.com
- Ahmed Qasim Jaafar, Karbala Heart Center, Karbala, Iraq; Email: Ahmedqasim443@yahoo.com
ABSTRACT
Background & objective: Atherosclerosis (AS) is a chronic inflammatory disease characterized by the accumulation of lipids, cholesterol, and other substances on the arterial walls. This leads to plaque formation, which can narrow and harden the arteries, leading to reduced blood flow. We aimed to study the association between sub-clinical/ clinical AS and serum levels of Midkine (MK) in patients.
Materials and Methods: This cross-sectional study included 90 male participants aged 20-60 years (mean age 33.00 ± 6.131 years). Participants were divided into two groups: 45 patients with clinical coronary AS (mean age 34.50 ± 4.949 years) and 45 patients with subclinical coronary AS (mean age 32.25 ± 7.228 years). The serum Midkine, insulin, and fasting blood glucose were calculated using an Enzyme-Linked Immunosorbent Assay (ELISA), whereas HbA1C measurement was conducted by a spectrophotometer.
Results: The results demonstrated a highly significant elevation (P ≤ 0.01) in Midkine levels among patients with clinical AS (2.728 ± 0.411) compared to those with subclinical AS (1.056 ± 0.160). Additionally, patients with clinical AS exhibited significantly higher levels (P ≤ 0.01) of multiple metabolic parameters compared to the subclinical group, including random glucose, insulin, and HbA1C. Lipid profile analysis revealed significant increases (P ≤ 0.01) in total cholesterol (TC), triglycerides (TG), low-density lipoprotein (LDL), and very low-density lipoprotein (VLDL) in the clinical AS group relative to the subclinical AS group.
Conclusion: This study highlighted a significant link between elevated serum MK levels and atherosclerosis risk factors, including diabetes mellitus and increased total and LDL cholesterol. C-peptide, insulin, HOMA-IR can be regarded as the main indicators of diabetic mellitus markers. Therefore, MK can be considered early diagnosis and prognosis biomarker for atherosclerosis.
Abbreviations: AS: Atherosclerosis, DM: Diabetes mellitus, LDL: low-density lipoprotein, MK: Midkine, TC: total cholesterol, TG: triglycerides, VLDL: very low-density lipoprotein, HOMA-IR: Homeostatic Model Assessment of Insulin Resistance
Keywords: Cholesterol; Coronary Atherosclerosis; Diabetes Mellitus; HOMA-IR; HbA1C; Lipoprotein; Midkine; Triglycerides
Citation: Khudair ZH, Yousif AC, Jaafar AQ. Midkine (MK) as a novel biomarker of clinical-subclinical coronary atherosclerosis and related to diabetes mellitus: clinical applications. Anaesth. pain intensive care 2025;29(6):559-566. DOI: 10.35975/apic.v29i6.2915
Received: June 10, 2025; Revised: Jul 16, 2024; Accepted: Jul 24, 2025
1. INTRODUCTION
Atherosclerosis (AS) is a chronic and progressive disease characterized by the thickening and hardening of arterial walls due to the accumulation of lipids, inflammatory cells, and fibrous elements.1,2 Subclinical AS refers to the early stages of AS in which structural changes occur in the blood vessels without causing noticeable symptoms. At this stage, fatty deposits (plaques) begin to accumulate in the arterial walls, but they have not yet caused significant narrowing or blockage that would lead to clinical signs like chest pain (angina), heart attack, or stroke.3,4
Clinical AS refers to the symptomatic and advanced stage of AS, in which the buildup of fatty plaques inside the arteries has progressed enough to cause measurable blood flow restriction and lead to clinical events or symptoms.5
The pathogenesis of AS involves multiple stages, including endothelial dysfunction, lipid accumulation, inflammatory response, and plaque formation, which can lead to plaque instability and rupture.6,7
Diabetes mellitus (DM) is a chronic metabolic disorder characterized by persistent hyperglycemia due to defects in insulin secretion, insulin action, or both. The main types include Type 1, Type 2, and gestational diabetes, with risk factors such as genetic predisposition, obesity, age, and lifestyle choices contributing to its rising incidence.8,9
Diabetes accelerates AS through multiple mechanisms: endothelial dysfunction, dyslipidemia, inflammation, and a pro-thrombotic state. This makes cardiovascular disease (CVD) the leading cause of death in people with diabetes.10,11
Midkine (MK) is a heparin-binding growth factor that plays a significant role in the pathogenesis of AS, a chronic inflammatory disease characterized by the accumulation of lipids and fibrous elements in the large arteries. MK is involved in various biological processes, including inflammation, angiogenesis, and cell survival, which are critical in the development and progression of atherosclerotic plaques.12,13
Midkine contributes to AS through its pro-inflammatory, pro-angiogenic, and anti-apoptotic effects, as well as by promoting lipid accumulation in macrophages. Its elevated levels in various cardiovascular conditions highlight its potential as both a biomarker and a therapeutic target in atherosclerotic disease.12
The study aims to investigate Midkine levels and assess their association with diabetes mellitus in patients with both subclinical and clinical AS.
2. METHODOLOGY
A cross-sectional study of 90 males with a range of ages 20 ≥ 60 years, mean age of 33.00 years, were enrolled in the present study, divided into 45 patients with clinical coronary AS, with a mean age of (34.500 ± 4.949), and 45 patients with sub-clinical coronary AS, with a mean age of 32.250 ± 7.228. The study was conducted to evaluate the clinical and sub-clinical coronary AS males related to type 2 diabetes in Karbala, Iraq. Diabetes can be classified into three main categories: non-diabetes (normal), prediabetes, and diabetes.14 The data were collected and recorded from September 2024 to December 2024 at the Imam Hussein Karbala Center for Heart Diseases and Surgery Teaching Hospital. Diseases were diagnosed through laboratory tests, monitoring some clinical symptoms, and all patients were diagnosed by conventional coronary angiography or CT scan by a cardiologist. Moreover, information for each group was collected according to the questionnaire. The exclusion criteria of this study were: female gender, patients with a history of an endocrine disease, cancers, liver disease, nephropathy, and alcohol intake. The inclusion criteria were: male patients with clinical or sub-clinical coronary AS.
Five milliliters of venous blood samples were obtained from each fasting patient via venepuncture with a sterile syringe. All samples were identified by their specific numbers (ID) generated by the laboratory information system. Blood (2 mL) was placed in the EDTA tube (ethylene diamine tetraacetic acid) to prevent clotting of blood for hematological parameters to measure HbA1C. For fasting blood glucose, 3 mL of blood was placed in the plain tube and allowed to clot (to get the serum), and then centrifuged at 4000 rpm for ten minutes.
Serum insulin levels were measured using an insulin kit (Elabsciences, Wuhan, China) employing the Sandwich-ELISA method. HbA1c was measured using an automated chemistry analyzer (Cobas Integra 400 plus) with a kit from OSN, Korea. Lipid profile was assessed using a kit from Linear Chemicals S.L, Spain, measured by the enzymatic colorimetric technique. Homeostatic Model Assessment of Insulin Resistance (HOMA-IR) was calculated using the following formula:
(HOMA‑IR = fasting plasma insulin (µU/ml) × fasting plasma glucose (mg/dl)/405)(9).
Midkine (MK) kit
Samples were allowed to clot for 1 hour at room temperature or overnight at 2-8℃ before centrifugation for 20 min at 1000×g at 2-8℃. The supernatant was collected to carry out the assay.
The (Elabsciences, Wuhana,China) kit is based on the Sandwich ELISA method. The microplate included in the kit is pre-coated with an antibody that specifically targets human midkine (MK). When samples or standards are added to the wells, they bind to the immobilized antibody, allowing for the detection of MK through this specific interaction.
2.1. Sample size determination
In order to determine an appropriate and statistically valid sample size for this cross-sectional study, the finite population correction (FPC) method was applied. This approach is particularly suitable when the total population is known and not extremely large (typically under a few million), as is the case in this study. The target population is the general population of Karbala city, which has an estimated population of 800,000 individuals. The sample size calculation was based on the following formula according to Cochran.19
- Estimated prevalence (p) of AS in the general population: 6% (0.06)
- Confidence level: 95%, which corresponds to a Z-score of 1.96
- Margin of error (e): 5% (0.05)
- Population size (N): 800,000 individuals
2.2. Statistical Analysis
Data analysis was conducted statistically by employing SPSS statistical packages version 23. The analysis results were summarized using descriptive statistics. In addition, mean and standard deviation were calculated, and to assess the statistical significance of the experimental results, a p-value threshold of 0.05 probability threshold was utilized. Furthermore, the normality of the data was verified using the Shapiro-Wilk test, while the homogeneity of variance was examined with the Levene test. Nevertheless, to investigate the association between categorical and numerical variables, chi-square and Pearson's correlation analyses were conducted. Statistical differences for two independent groups were determined using the Mann-Whitney Test and the Independent T-Test. Besides, multiple comparisons between groups were performed using analysis of variance (ANOVA), followed by Scheffe's post-hoc tests for multiple comparisons within groups. Moreover, to find out the cut-off points of the research parameters for critical patients, receiver operating characteristic (ROC) analyses were administered. AUC was used for prediction strength, and optimum cut-off points were chosen using Youden’s index. An asterisk indicates data with a P < 0.01.
3. RESULTS
The results showed a significant increase in the random glucose, insulin, HOMA IR, HbA1C, C-peptide, and midkine in sub-clinical AS patients (P < 0.05). Meanwhile, the level of fasting plasma glucose in clinical AS showed a non-significant increase compared to sub-clinical AS patients (P = 0.21457).
| Table 1: Comparative serum concentration of blood glucose, insulin hormone, and Midkine in Clinical and subclinical AS patients | |||
| Parameters | Subclinical AS
(n = 45) |
Clinical AS
(n = 45) |
P-value |
| Fasting plasma glucose (mg/dl) | 199.222 ± 100.145 | 223.629 ± 84.402 | 0.21457 |
| Random glucose(mg/dl) | 119.677 ± 13.521 | 204.484 ± 47.004 | 0.00005 |
| Insulin (µIU/ml) | 2.582 ± 0.238 | 4.175 ± 1.667 | 0.00010 |
| HOMA IR | 0.760 ± 0.091 | 2.137 ± 1.059 | 0.00004 |
| HbA1c(mmol/mol) | 7.240 ± 2.747 | 8.893 ± 2.462 | 0.00344 |
| C-Peptide(pg/ml) | 40.291 ± 9.174 | 123.614 ± 32.939 | 0.00007 |
| Midkine (ng/ml) | 1.056 ± 0.160 | 2.728 ± 0.411 | 0.00009 |
| Data presented as mean ± SD; P < 0.05 considered significant | |||
The results showed a significant (P ≤ 0.01) increase in cholesterol, triglyceride, low-density lipoprotein (LDL), and very low-density lipoprotein (VLDL) levels in sub-clinical AS group. However, there was a significant decrease in the level of high-density lipoprotein in clinical AS patients as compared to sub-clinical AS patients (P = 0.00002) (Table 2).
| Table 2: Comparison of serum concentration of lipid profile | |||
| Parameters | Subclinical AS
(n = 45) |
Clinical AS
(n = 45) |
P-value |
| Total cholesterol (mg/dl) | 197.785 ± 19.577 | 247.170 ± 28.155 | 0.00005 |
| Total triglycerides (mg/dl) | 208.802 ± 20.866 | 249.431 ± 20.182 | 0.00007 |
| Low-density lipoprotein (mg/dl) | 96.370 ± 19.841 | 156.089 ± 27.699 | 0.00010 |
| High-density lipoprotein (mg/dl) | 59.654 ± 9.309 | 41.195 ± 8.828 | 0.00002 |
| Very Low-Density Lipoprotein (mg/dl) | 41.760 ± 4.173 | 49.886 ± 4.036 | 0.00007 |
| Data presented as mean ± SD; P < 0.05 considered significant | |||
The results revealed a significant decrease in MK level (P ≤ 0.01) in the subclinical AS group, regardless of the age groups, family history, smoking status, and area (Table 3).
| Table 3: Comparative demographic parameters between subclinical and clinical AS patients | ||||
| Demographic | Groups | Midkine (ng/ml) | ||
| Subclinical AS | Clinical AS | P- value | ||
| Age Group | 40 -59 | 1.072 ± 0.131 | 2.735 ± 0.430 | 0.00001 |
| 60 – 79 | 1.038 ± 0.190 | 2.724 ± 0.407 | 0.00001 | |
| Family history | No | 0.987 ± 0.100 | 2.752 ± 0.403 | 0.00001 |
| Yes | 1.085 ± 0.172 | 2.717 ± 0.421 | 0.00001 | |
| Smoking state | None Smoker | 1.072 ± 0.239 | 2.510 ± 0.405 | 0.00001 |
| Smoker | 1.052 ± 0.134 | 2.799 ± 0.394 | 0.00001 | |
| Address area | Rural | 1.019 ± 0.105 | 2.657 ± 0.280 | 0.00001 |
| Urban | 1.083 ± 0.187 | 2.775 ± 0.479 | 0.00001 | |
| Data presented as mean ± SD; P < 0.05 considered significant | ||||
He results showed a significant decrease in cholesterol, triglycerides, low-density lipoprotein, and very low-density lipoprotein (p ≤ 0.01) in subclinical AS patients across non-diabetic, pre-diabetic, and diabetic groups. On the other hand, the results showed a significant increase in HDL cholesterol (P ≤ 0.01) in subclinical AS patients across non-diabetic, pre-diabetic, and diabetic groups. However, the values for the AS patients were (47.025 ± 6.061), (42.266 ± 9.687), and (39.619 ± 8.688), respectively (Table 4).
| Table 4: Comparison of serum concentration of lipid profile in Clinical –Sub clinical AS patients according to classification of diabetes mellitus groups. | ||||
| Parameters | Group | Subclinical AS
(n = 45) |
Clinical AS
(n = 45) |
P-value |
| Total cholesterol (mg/dl) | No diabetes | 198.964 ± 23.844 | 252.036 ± 20.884 | 0.00014 |
| Pre diabetes | 189.877 ± 15.378 | 249.010 ± 29.543 | 0.00003 | |
| Diabetes | 200.854 ± 17.682 | 245.529 ± 29.634 | 0.00001 | |
| Total triglycerides (mg/dl) | No diabetes | 213.597 ± 17.440 | 238.369 ± 32.163 | 0.03283 |
| Pre diabetes | 200.355 ± 24.085 | 253.307 ± 22.472 | 0.00008 | |
| Diabetes | 209.429 ± 21.290 | 250.383 ± 16.141 | 0.00001 | |
| Low-density lipoprotein (mg/dl) | No diabetes | 94.579 ± 24.995 | 157.337 ± 19.156 | 0.00003 |
| Pre diabetes | 93.241 ± 17.816 | 156.083 ± 31.249 | 0.00003 | |
| Diabetes | 99.279 ± 16.865 | 155.833 ± 28.738 | 0.00001 | |
| High density lipoprotein (mg/dl) | No diabetes | 61.666 ± 8.281 | 47.025 ± 6.061 | 0.00095 |
| Pre diabetes | 56.565 ± 9.877 | 42.266 ± 9.687 | 0.00427 | |
| Diabetes | 59.689 ± 9.784 | 39.619 ± 8.688 | 0.00001 | |
| Very Low Density Lipoprotein (mg/dl) | No diabetes | 42.719 ± 3.488 | 47.674 ± 6.433 | 0.03283 |
| Pre diabetes | 40.071 ± 4.817 | 50.661 ± 4.494 | 0.00008 | |
| Diabetes | 41.886 ± 4.258 | 50.077 ± 3.228 | 0.00001 | |
| Data presented as mean ± SD; P < 0.05 considered significant | ||||
Figure 1: ROC curve analysis of Midkine predictive accuracy for AS detection.
The results demonstrated a significant decrease (P ≤ 0.01) in random glucose and c-peptide in non-diabetic, pre-diabetic and diabetic. Also, the decrease was shown in insulin, HOMA-IR, e NOS, and Mdkine in diabetics in sub-clinical AS patients as in Table 5.
| Table 5: Comparison of serum concentration of glucose parameters in clinical–subclinical AS patients according to the classification of diabetes mellitus groups. | ||||
| Parameters | Group | Subclinical AS | Clinical AS | P-value |
| Fasting plasma glucose (mg/dl) | No diabetes | 127.667 ± 36.533 | 230.167 ± 103.438 | 0.05937 |
| Pre diabetes | 158.000 ± 58.038 | 162.500 ± 45.140 | 0.84870 | |
| Diabetes | 273.500 ± 99.509 | 243.355 ± 82.959 | 0.25509 | |
| Random glucose(mg/dl) | No diabetes | 115.090 ± 10.264 | 148.008 ± 23.694 | 0.01777 |
| Pre diabetes | 116.678 ± 13.350 | 183.001 ± 35.115 | 0.00003 | |
| Diabetes | 124.618 ± 14.638 | 223.577 ± 41.827 | 0.00001 | |
| insulin(µIU/ml) | No diabetes | 2.569 ± 0.226 | 3.745 ± 1.687 | 0.14887 |
| Pre diabetes | 2.594 ± 0.329 | 4.008 ± 1.866 | 0.04106 | |
| Diabetes | 2.585 ± 0.204 | 4.321 ± 1.634 | 0.00001 | |
| HOMA IR | No diabetes | 0.727 ± 0.059 | 1.401 ± 0.778 | 0.08737 |
| Pre diabetes | 0.747 ± 0.123 | 1.867 ± 1.047 | 0.00806 | |
| Diabetes | 0.791 ± 0.087 | 2.383 ± 1.048 | 0.00001 | |
| HbA1c (mmol/mol) | No diabetes | 4.381 ± 0.783 | 4.768 ± 0.390 | 0.26769 |
| Pre diabetes | 6.388 ± 0.395 | 7.035 ± 0.457 | 0.00326 | |
| Diabetes | 9.810 ± 1.778 | 10.387 ± 1.497 | 0.22496 | |
| C-Peptide (pg/ml) | No diabetes | 38.617 ± 8.568 | 100.411 ± 47.739 | 0.02450 |
| Pre diabetes | 40.023 ± 12.081 | 119.324 ± 38.916 | 0.00001 | |
| Diabetes | 41.681 ± 8.209 | 129.894 ± 25.464 | 0.00001 | |
| Midkine (ng/ml) | No diabetes | 1.091 ± 0.141 | 2.626 ± 0.534 | 0.00076 |
| Pre diabetes | 0.983 ± 0.116 | 2.847 ± 0.433 | 0.00001 | |
| Diabetes | 1.067 ± 0.185 | 2.708 ± 0.384 | 0.00001 | |
| Data presented as mean ± SD; P < 0.05 considered significant | ||||
Figure 2: ROC curve analysis of glucose parameters predictive accuracy for AS detection
Table 6 shows the cutoff points, AUC with sensitivities, specificities, and accuracies of the biomarkers.
| Table 6: ROC for evaluation of diagnostic accuracy and predictive value for AS biomarkers. | |||||
| Metrics
|
Insulin (μIU/ml) | HOMA IR | HbA1c
(mmol/mol) |
Midkine
(ng/ml) |
|
| Std. Error | 0.041 | 0.016 | 0.057 | 0.010 | |
| Asymptotic Sig. | 0.002 | 0.001 | 0.003 | 0.002 | |
| Asymptotic 95% Confidence Interval | 0.766 | 0.939 | 0.573 | 0.573 | 0.966 |
| 0.925 | 1.000 | 0.794 | 0.794 | 1.000 | |
| Cutoff Point | 2.793 | 0.991 | 7.350 | 1.685 | |
| Area Under Curve (AUC) | 84.568% | 97.037% | 68.370% | 98.519% | |
| Sensitivity | 71.111% | 91.111% | 71.111% | 95.556% | |
| Specificity | 84.444% | 97.778% | 60.000% | 97.778% | |
| Accuracy | 77.778% | 94.444% | 65.556% | 96.667% | |
| Positive Predictive Value | 82.051% | 97.619% | 64.000% | 97.727% | |
| Negative Predictive Value | 74.510% | 91.667% | 67.500% | 95.652% | |
4. DISCUSSION
The levels of fasting glucose, HbA1c, HOMA-IR, and insulin in clinical AS were elevated compared to subclinical AS. This is primarily because increased insulin resistance, chronic hyperglycemia, and insulin resistance impair glucose uptake, leading to higher blood glucose levels. This metabolic dysfunction is more pronounced in clinical AS, where systemic inflammation and endothelial dysfunction further exacerbate glycemic control. These factors collectively contribute to the progression from subclinical to clinical AS.15
Elevated lipid profiles (excluding HDL) are more pronounced in clinical AS because the disease is more advanced, with longer and more intense exposure to atherogenic lipids like LDL and triglycerides. In clinical AS, HDL levels are lower because chronic inflammation, oxidative stress, and metabolic issues like insulin resistance disrupt HDL production and function. These factors make HDL less effective and reduce its levels, especially alongside high triglycerides and enzyme imbalances, leading to decreased protective effects compared to earlier, subclinical stages.16-18 Clinical stages involve greater inflammation, metabolic disruption, and more harmful lipid particle types, often alongside comorbidities like diabetes or obesity. These factors contribute to higher lipid levels compared to subclinical (early, asymptomatic) AS.19,20
Several studies align with the current findings, demonstrating that increased insulin resistance, elevated glucose parameters, higher LDL and triglycerides, and reduced HDL are significantly associated with the progression from subclinical to clinical AS.21,22
MK levels are elevated in aging, smoking, and diabetes in the clinical AS group due to their association with chronic inflammation and tissue injury. MK's role in these processes highlights its potential as a biomarker for monitoring disease progression and therapeutic interventions.2,23,24
In patients with AS, glucose parameters are notably higher in those with diabetes and prediabetes, compared to nondiabetic individuals, due to several interrelated mechanisms. These include insulin resistance prevalent in prediabetics and diabetics, which leads to elevated blood glucose levels. This contributes to vascular dysfunction. Studies indicate that individuals with prediabetes exhibit a greater atherosclerotic burden than their nondiabetic counterparts, with significant increases in coronary artery plaque and stenosis severity.25,26
Diabetic dyslipidemia, often referred to as atherogenic dyslipidemia, is characterized by elevated levels of cholesterol and triglycerides, along with reduced HDL levels. To further investigate this association, the researchers of the current study examined the link between diabetes—another condition commonly linked to the development of AS—and lipid abnormalities.27,28
An increase in low-density lipoprotein (LDL) and a decrease in high-density lipoprotein (HDL) are significant risk factors for CVD, primarily due to endothelial dysfunction, coagulation abnormalities, and metabolic, hormonal, and hemodynamic changes associated with an altered lipid profile.29,30
5. LIMITATIONS
The study was conducted with a small sample size and at a single center. Although other studies have shown almost similar results, we recommend a multi-center study at a larger scale to achieve definitive numerical results.
6. CONCLUSION
This study concludes that serum levels of Midkine, insulin, HOMA-IR, HbA1c, and C-peptide are significantly elevated in patients with clinical AS compared to those with subclinical AS. Among these biomarkers, Midkine demonstrated the highest diagnostic accuracy, suggesting its effectiveness as a predictive biomarker for the early detection and diagnosis of AS in cardiovascular disease.
7. Data availability
The numerical data generated during this research are available from the authors.
8. Conflict of interest
All authors declare that there was no conflict of interest.
9. Funding
The study utilized the hospital resources only, and no external or industry funding was involved.
10. Authors’ contribution
All authors took an equal part in the conduct of the study and manuscript preparation.
11. REFERENCES
- Beverly JK, Budoff MJ. Atherosclerosis: pathophysiology of insulin resistance, hyperglycemia, hyperlipidemia, and inflammation. J Diabetes. 2020;12(2):102-4. [PubMed] DOI: 1111/1753-0407.12970
- Al-Fatlawi ACY. Association of EBV with Hodgkin and Non-Hodgkin Lymphoma for Females and Males Patients: Histological, Molecular and Survey Study in Karbala, Iraq. Int J Pharm Res. 2020;12(1). DOI: 31838/ijpr/2020.12.01.327
- Mszar R, Katz ME, Grandhi GR, Osei AD, Gallo A, Blaha MJ. Subclinical Atherosclerosis to Guide Treatment in Dyslipidemia and Diabetes Mellitus. Curr Atheroscler 2024;26(6):217-30. [PubMed] DOI: 10.1007/s11883-024-01202-w
- Hasan HR, Yousif Al-Fatlawi AC, Al-Obaidy QM. Kidney Injury Molecule-1 (KIM-1), Neutrophil GelatinaseAssociated Lipocalin (NGAL), and CRP: a potential biomarker for early prediction of Acute Kidney Injury (AKI) in pediatric male patients. Fam Med Prim Care Rev. 2024;26(4):464-70. DOI: 5114/fmpcr.2024.144914
- Zubirán R, Neufeld EB, Dasseux A, Remaley AT, Sorokin AV. Recent Advances in Targeted Management of Inflammation In Atherosclerosis: A Narrative Review. Cardiol Ther. 2024;13(3):465-91. [PubMed] DOI: 1007/s40119-024-00376-3
- Zhao N, Yu X, Zhu X, Song Y, Gao F, Yu B, et al. Diabetes Mellitus to Accelerated Atherosclerosis: Shared Cellular and Molecular Mechanisms in Glucose and Lipid Metabolism. J Cardiovasc Transl Res. 2024;17(1):133-52. [PubMed] DOI: 1007/s12265-023-10470-x
- Al-Fatlawi ACY. An evaluation of blood glucose and lipid profile in female hypothyroidism patients in Kerbala province, Iraq. Biomedicine. 2022;42(3):556-60. Full Text
- Yameny AA. Diabetes Mellitus Overview 2024. J Biosci Appl Res. 2024;10(3):641-5. DOI: 21608/jbaar.2024.382794
- Tahapary DL, Pratisthita LB, Fitri NA, Marcella C, Wafa S, Kurniawan F, et al. Challenges in the diagnosis of insulin resistance: focusing on the role of HOMA-IR and Tryglyceride/glucose index. Diabetes Metab Syndr. 2022;16(8):102581. [PubMed] DOI: 1016/j.dsx.2022.102581
- Zhao N, Yu X, Zhu X, Song Y, Gao F, Yu B, et al. Diabetes mellitus to accelerated atherosclerosis: Shared cellular and molecular mechanisms in glucose and lipid metabolism. J Cardiovasc Transl Res. 2024;17(1):133-52. [PubMed] DOI: 1007/s12265-023-10470-x
- Hasan HR, Al-Fatlawi ACY, Al-Obaidy QM. Evaluation of the levels of kidney injury molecule-1 and cystatin C as early biomarkers for prediction of acute kidney injury complications in paediatric male patients–a case-control study. Pediatr Pol. 2025;100(1). DOI: 5114/polp.2025.149167
- Majaj M, Weckbach LT. Midkine—A novel player in cardiovascular diseases. Front Cardiovasc Med. 2022;9:1003104. [PubMed] DOI: 3389/fcvm.2022.1003104
- Filippou PS, Karagiannis GS, Constantinidou A. Midkine (MDK) growth factor: a key player in cancer progression and a promising therapeutic target. Oncogene. 2020;39(10):2040-54. [PubMed] DOI: 1038/s41388-019-1124-8
- Xiong YJ, Meng XD, Xu HZ, Zhu XY. Association of frailty index with all-cause and cardiovascular mortality with different diabetic status: NHANES 1999–2018. Acta Diabetol. 2025;62(2):215-26. [PubMed] DOI: 1007/s00592-024-02348-4
- Scott DA, Ponir C, Shapiro MD, Chevli PA. Associations between insulin resistance indices and subclinical atherosclerosis: A contemporary review. Am J Prev Cardiol. 2024;18:100676. [PubMed] DOI: 1016/j.ajpc.2024.100676
- Al-Fatlawi ACY, AlSafi WG. Hematological study of some blood parameters for B-thalassemia major patients and effect on their fertility. In: AIP Conference Proceedings. AIP Publishing; 2020.
- Sirtori CR, Corsini A, Ruscica M. The Role of High-Density Lipoprotein Cholesterol in 2022. Curr Atheroscler Rep. 2022;24(5):365-77. [PubMed] DOI: 1007/s11883-022-01012-y
- Al-Fatlawi ACY. Evaluation of the effects of mobile phone electromagnetic radiation on some physiological parameters and histological structure in some laboratory male mice organs. 2022;7(4):56. Full Text
- Ahmadi A, Argulian E, Leipsic J, Newby DE, Narula J. From subclinical atherosclerosis to plaque progression and acute coronary events: JACC state-of-the-art review. J Am Coll Cardiol. 2019;74(12):1608-17. [PubMed] DOI: 1016/j.jacc.2019.08.012
- Kim HL. Differences in Risk Factors for Coronary Atherosclerosis According to Sex. J Lipid Atheroscler. 2024;13(2):97. [PubMed] DOI: 12997/jla.2024.13.2.97
- Rosenson RS, Brewer HB, Ansell BJ, Barter P, Chapman MJ, Heinecke JW, et al. Dysfunctional HDL and atherosclerotic cardiovascular disease. Nat Rev Cardiol. 2016;13(1):48-60. [PubMed] DOI: 1038/nrcardio.2015.124
- Powell-Wiley TM, Poirier P, Burke LE, Després JP, Gordon-Larsen P, Lavie CJ, et al. Obesity and cardiovascular disease: a scientific statement from the American Heart Association. Circulation. 2021;143(21):e984-e1010. [PubMed] DOI: 1161/CIR.0000000000000973
- Ito S, Sakakibara-Konishi J, Sato M, Shoji T, Furuta M, Takahashi H, et al. Midkine Promotes Tumor Growth and Attenuates the Effect of Cisplatin in Small Cell Lung Cancer. Cancer Med. 2025;14(13):e71034. [PubMed] DOI: 1002/cam4.71034
- Kambalapalli S, Bhandari M, Punnanithinont N, Iskander B, Khan MA, Budoff M. Bridging Prevention and Imaging: The Influence of Statins on CAC and CCTA Findings. Curr Atheroscler Rep. 2025;27(1):50. [PubMed] DOI: 1007/s11883-025-01287-x
- Açar B, Ozeke O, Karakurt M, Ozen Y, Özbay MB, Unal S, et al. Association of prediabetes with higher coronary atherosclerotic burden among patients with first diagnosed acute coronary syndrome. Angiology. 2019;70(2):174-80. [PubMed] DOI: 1177/0003319718772420
- Mellbin LG. Myocardial infarction and diabetes mellitus: studies on glucose lowering therapies and novel risk markers based on observations from the DIGAMI 2 trial. Karolinska Institutet; 2010. Available from: https://hdl.handle.net/10616/39684
- Ali F, Jamil H, Anwar SS, Wajid N. Characterization of lipid parameters in diabetic and non-diabetic atherosclerotic patients. J Geriatr Cardiol. 2015;12(1):37-.[PubMed] DOI: 11909/j.issn.1671-5411.2015.01.005
- Palombo C, Kozakova M. Lipids and Cardiovascular Organ Damage in Type 2 Diabetes Mellitus. Cardiol Cardiovasc Med. 2020;4(4):346-60. DOI: 26502/fccm.92920132