Redha Dawud Abd Alredha 1, Hassan Ali Farman 2
Author affiliations:
Background & Objective: The interplay between cardiac and renal dysfunction poses a major diagnostic and therapeutic challenge in acute heart failure (AHF). While high‐sensitivity troponin T (hs-TnT) and N‐terminal pro‐B‐type natriuretic peptide (NT‐proBNP) are valuable for cardiac assessment, they offer limited insights into renal injury. We evaluated the performance of plasma liver‐type fatty acid–binding protein (L‐FABP) in distinguishing acute cardiorenal syndrome (CRS) from AHF and its correlation with renal function.
Methods: A case-control study was conducted with 90 participants categorized as controls (n=30), AHF (n=30), and acute CRS (n = 30). Clinical and laboratory data were obtained, including echocardiographic parameters, serum creatinine, estimated glomerular filtration rate (eGFR), and biomarker levels (L‐FABP, hs-TnT, NT‐proBNP). Plasma L-FABP, hs-TnT, and NT-proBNP levels were measured and correlated with renal and cardiac functions. Receiver operating characteristic (ROC) curve analysis was used to assess the diagnostic performance of biomarkers in differentiating acute CRS from AHF.
Results: Plasma L‐FABP levels were markedly elevated in CRS compared to both AHF and controls (P < 0.001). L‐FABP demonstrated a stronger correlation with serum creatinine (r = 0.84) and an inverse relationship with eGFR (r = −0.55) relative to the other biomarkers. In ROC analyses, L‐FABP showed the highest discriminatory power (AUC = 0.968) in differentiating CRS from AHF, exceeding hs-TnT (0.958) and NT‐proBNP (0.913). Multiple regression analysis revealed that only L‐FABP remained a significant independent predictor of current renal impairment (P = 0.001).
Conclusion: Plasma L‐FABP offers superior diagnostic accuracy and correlates more closely with renal dysfunction than conventional cardiac markers in AHF and CRS. Integrating L‐FABP into routine evaluation may enhance early risk stratification and guide targeted therapeutic interventions for patients at risk of worsening kidney injury.
Abbreviations: AHF: Acute heart failure, CRS: cardiorenal syndrome, hs‐TNT: high‐sensitivity troponin T, L-FABP: liver‐type fatty acid–binding protein
Keywords: Acute Heart Failure; AHF; CRS; hs-Tnt; NT-Probnp; Plasma L-FABP
Citation: Alredha RD, Farman HA. Plasma L-FABP as a superior biomarker for detecting and characterizing cardiorenal syndrome in acute heart failure: comparative insights with hs‐troponin T and NT‐proBNP. Anaesth. pain intensive care 2025;29(2):284-293. DOI: 10.35975/apic.v29i2.2717
Received: September 27, 2024; Reviewed: October 24, 2024; Accepted: January 01, 2025
Acute cardiorenal syndrome (CRS) is a complex, bidirectional disorder in which acute dysfunction of the heart precipitates acute kidney injury (AKI) and vice versa, leading to synergistic deterioration of both organs.1 This intricate interaction poses significant diagnostic and therapeutic challenges, particularly in distinguishing acute CRS from acute heart failure (AHF), as both conditions frequently exhibit overlapping clinical manifestations, including congestion, renal impairment, and hemodynamic instability.2, 3 Accurate early differentiation between these syndromes is essential for guiding appropriate therapeutic interventions because misclassification may lead to suboptimal management strategies, resulting in increased morbidity, prolonged hospitalization, and higher mortality rates.4
The integration of biomarkers into clinical decision making has significantly enhanced the diagnostic and prognostic assessment of cardiovascular and renal diseases. Biomarkers provide pathophysiological insights into myocardial stress, renal injury, and hemodynamic overload, thereby refining risk stratification and therapeutic guidance.5, 6 In the context of CRS and AHF, plasma and urinary biomarkers have been extensively studied for their potential to differentiate between these conditions, with particular emphasis on markers of renal tubular injury, myocardial injury, and natriuretic peptides.7
Among renal biomarkers, liver-type fatty acid-binding protein (L-FABP), a 14 kDa protein predominantly expressed in proximal tubular epithelial cells, has emerged as a sensitive marker of renal ischemia and oxidative stress-induced injury.8 L-FABP plays a crucial role in intracellular fatty acid transport and protection against lipid peroxidation, and its urinary and plasma levels have been associated with the early detection of AKI in critically ill patients.9 Notably, Naruse, Ishii, 10 demonstrated that elevated urinary L-FABP levels at hospital admission independently predicted AKI in patients admitted to cardiac intensive care units (CICUs), highlighting its clinical utility in detecting renal dysfunction before traditional markers, such as creatinine, exhibit significant changes.
In parallel, high-sensitivity troponin T (hs-TnT) has been established as a highly specific biomarker for myocardial injury, with elevated levels reflecting ongoing cardiomyocyte stress, necrosis, or ischemia.11 Elevated hs-TnT levels have been strongly associated with adverse clinical outcomes in heart failure patients, particularly in those with underlying renal impairment, as reduced clearance may exacerbate troponin accumulation, further complicating cardiorenal interplay.12
Furthermore, N-terminal pro-B-type natriuretic peptide (NT-proBNP), a well-documented marker of ventricular volume overload and myocardial wall stress, is a key indicator of heart failure severity and prognosis.13 NT-proBNP is secreted by cardiomyocytes in response to increased ventricular pressure, and its elevation correlates with a worsening functional status, increased hospitalization rates, and mortality in patients with heart failure.14 Importantly, NT-proBNP levels have been shown to correlate with renal function, as impaired renal clearance in CRS may result in persistently elevated levels, necessitating careful interpretation in cardiorenal patients.15
Despite the availability of these biomarkers, distinguishing acute CRS from AHF remains a clinical challenge because both syndromes share common pathophysiological mechanisms and overlapping biomarker elevations. No single biomarker has demonstrated sufficient specificity to definitively differentiate between these conditions, emphasizing the need for a multimodal biomarker approach.16 This study aimed to evaluate the diagnostic and prognostic utility of plasma L-FABP, hs-TnT, and NT-proBNP levels in distinguishing acute CRS from AHF. By elucidating the interrelationships between renal dysfunction, myocardial stress, and hemodynamic overload, this study seeks to enhance biomarker-based risk stratification, improve early detection strategies, and ultimately optimize patient outcomes in this high-risk population.
2.1. Study Design and Participants
This case-control study was conducted at Al-Sadr Teaching Hospital in Najaf, Iraq, from June 2024 to December, 2024, enrolling a total of 90 participants, who were classified into three groups: a control group (n=30) consisting of healthy individuals without a history of cardiovascular or renal disease, an AHF group (n=30) comprising patients diagnosed of AHF, based on clinical presentation and echocardiographic findings, and an acute CRS group (n=30), defined by the presence of both AHF and AKI according to the ‘Kidney Disease: Improving Global Outcomes’ (KDIGO) criteria.17 The study was approved by the Institutional Review Board (No. 34328). All participants provided written informed consent in compliance with the principles of the Declaration of Helsinki.18 The sample size (n) was determined using the following formula to compare two proportions in case-control studies19:
2.2. Data Collection
Demographic details (age and sex) and relevant medical history were documented. Anthropometric measurements included body mass index (BMI)(22). The clinical assessment included the New York Heart Association (NYHA) functional classification, which was used to evaluate the severity of heart failure symptoms, categorizing patients from Class I (asymptomatic) to Class IV (severe limitation of activity) (23). The left ventricular ejection fraction (EF) was determined using transthoracic echocardiography (TTE) and classified as preserved EF (>50%), mid-range EF (40-49%), and reduced EF (<40%) based on the European Society of Cardiology (ESC) guidelines (24). The duration of hospitalization was also recorded and stratified into two categories, ≤7 days and >7 days, to assess the impact of biomarker levels on patient outcomes (25).
2.3. Sample Collection
Venous blood samples (5–7 mL) were collected from each participant via standard phlebotomy into serum separator tubes (SST) and ethylenediaminetetraacetic acid (EDTA) plasma tubes. Samples were drawn under fasting conditions (if clinically feasible) or at a standardized time point immediately after admission. Tubes were centrifuged at 3,000 × g for 10 min at 4°C, and serum and plasma aliquots were stored at –80°C until assay.
2.4. Biochemical Measurements
Laboratory measurements were performed using venous blood samples collected at the time of hospital admission. Plasma and serum were separated by centrifugation at 1500 × g for 15 min and stored at -80°C until biomarker analysis. Plasma L-FABP levels were measured using an enzyme-linked immunosorbent assay (ELISA) kit (Cat No. LS-F6955, LifeSpan BioSciences, USA) with a detection range of 0.1–50 ng/mL. High-sensitivity Troponin T (hs-TnT) levels were determined using the Elecsys® Troponin T hs assay (Cat No. 05092744 190, Roche Diagnostics, Switzerland), which has a lower detection limit of 5 ng/L and 99th percentile cutoff of 14 ng/L. N-terminal pro-B-type natriuretic peptide (NT-proBNP) was quantified using the Elecsys® pro-BNP II immunoassay (Cat No. 04842464 190, Roche Diagnostics, Switzerland), with a measurement range of 5–35,000 pg/mL. Serum creatinine levels were assessed using a Jaffé kinetic colorimetric assay (Cobas c702, Roche Diagnostics, Switzerland), and the estimated glomerular filtration rate (eGFR) was calculated using the CKD-EPI equation26 as follows:
eGFRcr = 142 × min (Scr/κ, 1) α × max (Scr/κ, 1)-1.200 x 0.9938Age × 1.012 [if female].
In addition to biomarker quantification, complete blood count (CBC), including white blood cell (WBC) count, red blood cell (RBC) count, and hemoglobin (Hb) level, were measured using an automated hematology analyzer (XN-9000, Sysmex, Japan). Serum sodium and potassium concentrations were determined using an ion-selective electrode method (Cobas 6000, Roche Diagnostics, Switzerland).
2.5. Statistical Analysis
The GraphPad Prism 9 software application was used to ascertain the impact of disparate groups (patients versus controls) on the study parameters. The T-test was used to conduct a significant comparison of the means. The Chi-square test was implemented to perform a significant comparison of percentages at the 0.05 and 0.01 probability levels. Estimations of the correlation coefficients and multiple linear regression analyses were conducted for the variables. The sensitivity and specificity of the parameters were evaluated in both the patient and control groups. Cutoff values for the biomarkers were established using Receiver Operating Characteristic (ROC) curve analysis, aimed at optimizing both sensitivity and specificity. The Youden Index was used to determine the optimal threshold for each parameter.27
Demographic, clinical, and laboratory parameters are compared across the three groups. There were no significant intergroup differences in age, sex distribution, or BMI (all P > 0.05) (Table 1). However, both the duration of hospitalization and NYHA functional classes differed notably, with acute CRS patients all having longer stays (>7 days) and more severe NYHA classes compared to the AHF group (P < 0.001). EF progressively declined from control (63.77 ± 4.30%) to AHF (45.70 ± 5.08%) to acute CRS group (32.73 ± 2.49%; P < 0.001), reflecting worsening cardiac function (Table 1).
Renal indices (BUN, serum creatinine, and eGFR) were significantly altered among the three groups, with the most pronounced renal impairment observed in acute CRS group (all P < 0.001). Similarly, WBC counts were the highest and RBC counts the lowest in the acute CRS group (both P < 0.001), indicating heightened inflammatory status and possible anemia. Hb values were also significantly reduced in both AHF and CRS compared to controls (P < 0.001). Lastly, serum sodium and potassium levels varied markedly, with lower sodium and higher potassium in acute CRS, suggestive of notable electrolyte disturbances (P < 0.001).
In Table 2 all three measured biomarkers—Hs‐TnT, NT‐proBNP, and plasma L‐FABP—demonstrated highly significant differences among the control, AHF, and acute CRS groups (P < 0.001). Hs-TnT and NT‐proBNP, both indicators of cardiac stress, showed stepwise elevations from control to AHF and reached their highest levels in acute CRS. A similar trend emerged for plasma L‐FABP, with markedly increased concentrations in acute CRS compared to both AHF and controls. As illustrated in Figure 1, multiple comparison testing confirmed that the mean plasma L‐FABP differences between each pair of groups (control vs. AHF, control vs. CRS, and AHF vs. CRS) were statistically significant, reflecting a clear gradient of rising biomarker levels in the setting of worsening cardiac and renal dysfunction.
Table 3 reveals a significant association between prolonged hospitalization (>7 days) and elevated levels of Plasma L-FABP, hs-TNT, and NT-proBNP (P < 0.001).
Patients with extended hospitalization had markedly higher Plasma L-FABP, hs- TNT, and NT-proBNP compared to those hospitalized for ≤ 7 days.
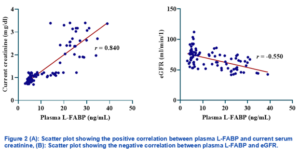
Figure 2A reveals a strong, positive correlation (r = 0.840) between plasma L‐FABP and current serum creatinine levels, indicating that rising L‐FABP concentrations are closely associated with increased renal impairment. In contrast, Figure 2B demonstrates a moderate, negative correlation (r = −0.550) between plasma L‐FABP and eGFR, suggesting that higher L‐FABP values coincide with diminishing glomerular filtration rates.
In Table 4, plasma L‐FABP demonstrated the highest diagnostic accuracy for distinguishing acute CRS from acute AHF, with an AUC of 0.968 (P < 0.001). By comparison, hs-TnT (AUC = 0.958) and NT‐proBNP (AUC = 0.913) also showed excellent performance (P < 0.001 for both). The cutoff values derived for each biomarker (17.98 ng/mL for L‐FABP, 738.65 pg/mL for hs-TnT, and 7.97 ng/mL for NT‐proBNP) yielded high sensitivities (0.80–0.97) and specificities (0.90–0.93).
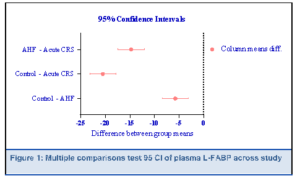
Table 5 show multiple linear regression model incorporating plasma L‐FABP, hs-TnT, and NT‐proBNP explained 81 of the variance in current serum creatinine (R² = 0.811; F = 46.325; P < 0.001). Of the three biomarkers, only plasma L‐FABP emerged as a statistically significant independent predictor of creatinine levels (B = 0.532, P = 0.001), indicating that rising L‐FABP is strongly associated with higher creatinine. In contrast, hs-TnT (B = 0.089, P = 0.334) and NT‐proBNP (B = 0.110, P = 0.219) did not significantly contribute to the model. The overall model was highly significant (R² = 0.811, F-ratio = 46.325, P < 0.001), indicating that these biomarkers collectively explained a substantial proportion of creatinine variability, with plasma L-FABP being the most influential predictor.
The intricate pathophysiology underlying CRS involves hemodynamic alterations, neurohormonal activation, inflammation, oxidative stress, and endothelial dysfunction, all of which create a vicious cycle of worsening organ function (28). Given the high morbidity and mortality associated with CRS, the identification of reliable biomarkers for early diagnosis, risk stratification, and prognosis is of paramount importance.29 Our study underscores the pivotal role of plasma L‐FABP in delineating the complex pathophysiology of AHF and acute CRS. By demonstrating a stronger association with renal function indices (serum creatinine and eGFR) than either hs-TnT or NT‐proBNP, L‐FABP appears to provide a more direct measure of tubular integrity in the context of acute cardiac decompensation. Furthermore, the superior diagnostic accuracy of L‐FABP in differentiating CRS from AHF adds to a growing body of literature that positions L‐FABP as a potent, renal‐focused biomarker in the cardiorenal continuum.30
Mechanistically, L‐FABP is an intracellular chaperone, binding and stabilizing free fatty acids, reducing their potential to undergo peroxidation and generate reactive oxygen species (ROS).9 Under normal circumstances, the kidney’s proximal tubule derives a substantial portion of its energy from β‐oxidation of fatty acids; however, in conditions of low perfusion pressure or increased venous congestion—both hallmarks of acute or chronic heart failure—tubular cells experience ischemia, leading to an accumulation of partially oxidized fatty acids and subsequent cellular injury.31 In response, L‐FABP expression rises in proximal tubular cells, and excess L‐FABP is released into the bloodstream (or urine), thus serving as a real‐time gauge of tubular stress.32 Beyond its role as a marker, some reports suggest that L‐FABP may also mitigate further lipid peroxidation damage; however, persistent hemodynamic derangements can overwhelm this protective mechanism, resulting in continued renal function decline.10
Importantly, while hs-TnT and NT‐proBNP reflect myocardial injury and wall stress, respectively, they do not specifically address renal tubular pathology. As such, our regression analysis showing that only L‐FABP contributed significantly to predicting serum creatinine highlights a missing piece in standard AHF biomarker panels. The data bolster the concept that CRS is driven by a culmination of myocardial dysfunction, neurohormonal dysregulation, and direct tubular injury, each best captured by different—but complementary—biomarkers.33 This comprehensive approach resonates with the “multi‐organ heart failure” framework proposed in recent literature, which advocates for monitoring markers that reflect stress on both the heart and kidneys.16
One of the key findings of this study was the superior diagnostic accuracy of plasma L-FABP in distinguishing CRS from AHF, with an ROC AUC of 0.968. This finding is particularly significant, given that early differentiation between CRS and AHF is critical for optimizing treatment strategies. Combining L-FABP with NT-proBNP further improved the diagnostic precision, supporting previous research demonstrating that multi-marker approaches enhance early CRS detection. Elevated hs-TnT and NT-proBNP levels were significantly associated with prolonged hospitalization (>7 days) and increased disease severity, reinforcing their value as predictors of adverse clinical outcome. These results were consistent with those reported by Alhejily and Tan, Chan, who reported that elevated natriuretic peptides and troponins predict readmission risk and mortality in populations with heart failure.34, 35
Our findings align with earlier work by Naruse, Ishii, which demonstrated a robust correlation between L‐FABP and acute kidney injury severity.10 These authors noted that urinary L‐FABP levels reflected early tubular stress long before significant changes in serum creatinine were observed. Although our study focused on plasma L‐FABP, the mechanistic underpinning remains highly relevant: increased oxidative stress and lipid peroxidation in the proximal tubule lead to greater expression and release of L‐FABP.32 Similarly, Tang, Bakitas highlighted the profound influence of renal congestion and reduced forward perfusion on kidney injury in advanced heart failure.36 Our data support their proposition that interventions reducing venous pressure and enhancing cardiac output may concurrently alleviate tubular cell stress, reflected by a potential decline in L‐FABP concentrations. Several groups have also emphasized how CRS is not merely a unidirectional process of “heart failing the kidney” but rather an intricate interplay wherein kidney‐derived factors, such as heightened inflammatory mediators and neurohormonal signals, can aggravate cardiac dysfunction.33 This bidirectional crosstalk may help explain why conventional cardiac markers (hs-TnT, NT‐proBNP) alone do not fully capture the severity of CRS, whereas L‐FABP offers a more integrated view of tubulointerstitial pathology tied to hemodynamic compromise.
Clinically, our findings point to L‐FABP as a powerful early‐warning marker of renal compromise in patients with AHF, where even subclinical tubular damage may set the stage for progressive CRS. Early detection using L‐FABP could prompt more aggressive interventions, such as optimizing volume management to alleviate congestion, intensifying neurohormonal blockade, or employing device therapy to bolster cardiac output if needed.37 Indeed, Spring, Marsela showed that decongestive strategies aimed at lowering right atrial pressure can slow the trajectory of renal deterioration, presumably by reducing venous back‐pressure on the kidneys.38 While serum creatinine and eGFR remain the conventional indices, they are often late or insensitive indicators of kidney injury; incorporating L‐FABP measurements could refine risk stratification by identifying patients at immediate risk of renal deterioration before it becomes clinically evident.
Another practical consideration is monitoring treatment response. Given that L‐FABP levels rise and fall in tandem with tubular cell injury, serial measurements may track acute on chronic kidney insults in real time, thus enabling personalized, dynamic management. Future research should seek to determine if a decline in L‐FABP during therapy correlates with clinically meaningful outcomes, such as shorter hospital stays or reduced mortality in CRS.
This study has several limitations, including the small sample size, which may limit the generalizability and observational design, preventing causal inferences. The lack of longitudinal biomarker measurements limits our understanding of dynamic changes over time. Additionally, potential confounders, such as comorbidities (e.g., diabetes and chronic kidney disease), may have influenced the biomarker levels. Finally, as a single-center study, multicenter validation with larger cohorts is needed to confirm these findings and support clinical integration.
Future research should prioritize large-scale multicenter studies to validate the superior diagnostic performance of plasma L-FABP in differentiating CRS from AHF. Longitudinal studies are needed to assess the prognostic value of hs-TnT and NT-proBNP levels in predicting disease progression and treatment response. Additionally, integrating plasma L-FABP with novel renal biomarkers, such as NGAL and KIM-1, could enhance the early detection of AKI in CRS. Further investigations should explore biomarker-guided treatment strategies, using serial NT-proBNP measurements to optimize diuretic therapy and hs-TnT trends to assess myocardial stress and guide cardioprotective interventions in CRS management.
Our study reinforces the distinct pathophysiological significance of L‐FABP in AHF and CRS, demonstrating its strong correlation with renal dysfunction, potent discriminative ability for CRS, and independence from traditional cardiac markers. These data suggest that L‐FABP captures the intricate interplay of ischemic, congestive, and metabolic insults to the kidney in the setting of compromised cardiac function. Integrating L‐FABP measurement into standard practice could profoundly enhance early risk stratification, enabling the timely implementation of targeted strategies that protect renal function and potentially improve the overall prognosis of patients with CRS.
8. Acknowledgments
We extend our sincere gratitude to all participants who volunteered for this study, without whom this research would not have been possible. Our heartfelt thanks go to the medical and nursing staff at the Al-Sadr Teaching Hospital in Najaf, Iraq, for their invaluable assistance in patient recruitment and sample collection.
Author affiliations:
- Redha Dawud Abd Alredha, Department of Medical Laboratory Techniques, College of Health & Medical Techniques, Kufa / Al-Furat Al-Awsat Technical University, 31003 Al-Kufa, Iraq: Email: redha.alredha.chm@student.atu.edu.iq; ORCID: https://orcid.org/0009-0005-6774-5036.
- Hassan Ali Farman, Department of Cosmetic & Laser Technologies, College of Health & Medical Techniques, Kufa/ Al-Furat Al-Awsat Technical University, 31003 Al-Kufa, Iraq; Email: kuh.hsn@atu.edu.iq; Mobile 00964- 7830941793; ORCID: https://orcid.org/0000-0001-6825-6502
ABSTRACT
Background & Objective: The interplay between cardiac and renal dysfunction poses a major diagnostic and therapeutic challenge in acute heart failure (AHF). While high‐sensitivity troponin T (hs-TnT) and N‐terminal pro‐B‐type natriuretic peptide (NT‐proBNP) are valuable for cardiac assessment, they offer limited insights into renal injury. We evaluated the performance of plasma liver‐type fatty acid–binding protein (L‐FABP) in distinguishing acute cardiorenal syndrome (CRS) from AHF and its correlation with renal function.
Methods: A case-control study was conducted with 90 participants categorized as controls (n=30), AHF (n=30), and acute CRS (n = 30). Clinical and laboratory data were obtained, including echocardiographic parameters, serum creatinine, estimated glomerular filtration rate (eGFR), and biomarker levels (L‐FABP, hs-TnT, NT‐proBNP). Plasma L-FABP, hs-TnT, and NT-proBNP levels were measured and correlated with renal and cardiac functions. Receiver operating characteristic (ROC) curve analysis was used to assess the diagnostic performance of biomarkers in differentiating acute CRS from AHF.
Results: Plasma L‐FABP levels were markedly elevated in CRS compared to both AHF and controls (P < 0.001). L‐FABP demonstrated a stronger correlation with serum creatinine (r = 0.84) and an inverse relationship with eGFR (r = −0.55) relative to the other biomarkers. In ROC analyses, L‐FABP showed the highest discriminatory power (AUC = 0.968) in differentiating CRS from AHF, exceeding hs-TnT (0.958) and NT‐proBNP (0.913). Multiple regression analysis revealed that only L‐FABP remained a significant independent predictor of current renal impairment (P = 0.001).
Conclusion: Plasma L‐FABP offers superior diagnostic accuracy and correlates more closely with renal dysfunction than conventional cardiac markers in AHF and CRS. Integrating L‐FABP into routine evaluation may enhance early risk stratification and guide targeted therapeutic interventions for patients at risk of worsening kidney injury.
Abbreviations: AHF: Acute heart failure, CRS: cardiorenal syndrome, hs‐TNT: high‐sensitivity troponin T, L-FABP: liver‐type fatty acid–binding protein
Keywords: Acute Heart Failure; AHF; CRS; hs-Tnt; NT-Probnp; Plasma L-FABP
Citation: Alredha RD, Farman HA. Plasma L-FABP as a superior biomarker for detecting and characterizing cardiorenal syndrome in acute heart failure: comparative insights with hs‐troponin T and NT‐proBNP. Anaesth. pain intensive care 2025;29(2):284-293. DOI: 10.35975/apic.v29i2.2717
Received: September 27, 2024; Reviewed: October 24, 2024; Accepted: January 01, 2025
1. INTRODUCTION
Acute cardiorenal syndrome (CRS) is a complex, bidirectional disorder in which acute dysfunction of the heart precipitates acute kidney injury (AKI) and vice versa, leading to synergistic deterioration of both organs.1 This intricate interaction poses significant diagnostic and therapeutic challenges, particularly in distinguishing acute CRS from acute heart failure (AHF), as both conditions frequently exhibit overlapping clinical manifestations, including congestion, renal impairment, and hemodynamic instability.2, 3 Accurate early differentiation between these syndromes is essential for guiding appropriate therapeutic interventions because misclassification may lead to suboptimal management strategies, resulting in increased morbidity, prolonged hospitalization, and higher mortality rates.4
The integration of biomarkers into clinical decision making has significantly enhanced the diagnostic and prognostic assessment of cardiovascular and renal diseases. Biomarkers provide pathophysiological insights into myocardial stress, renal injury, and hemodynamic overload, thereby refining risk stratification and therapeutic guidance.5, 6 In the context of CRS and AHF, plasma and urinary biomarkers have been extensively studied for their potential to differentiate between these conditions, with particular emphasis on markers of renal tubular injury, myocardial injury, and natriuretic peptides.7
Among renal biomarkers, liver-type fatty acid-binding protein (L-FABP), a 14 kDa protein predominantly expressed in proximal tubular epithelial cells, has emerged as a sensitive marker of renal ischemia and oxidative stress-induced injury.8 L-FABP plays a crucial role in intracellular fatty acid transport and protection against lipid peroxidation, and its urinary and plasma levels have been associated with the early detection of AKI in critically ill patients.9 Notably, Naruse, Ishii, 10 demonstrated that elevated urinary L-FABP levels at hospital admission independently predicted AKI in patients admitted to cardiac intensive care units (CICUs), highlighting its clinical utility in detecting renal dysfunction before traditional markers, such as creatinine, exhibit significant changes.
In parallel, high-sensitivity troponin T (hs-TnT) has been established as a highly specific biomarker for myocardial injury, with elevated levels reflecting ongoing cardiomyocyte stress, necrosis, or ischemia.11 Elevated hs-TnT levels have been strongly associated with adverse clinical outcomes in heart failure patients, particularly in those with underlying renal impairment, as reduced clearance may exacerbate troponin accumulation, further complicating cardiorenal interplay.12
Furthermore, N-terminal pro-B-type natriuretic peptide (NT-proBNP), a well-documented marker of ventricular volume overload and myocardial wall stress, is a key indicator of heart failure severity and prognosis.13 NT-proBNP is secreted by cardiomyocytes in response to increased ventricular pressure, and its elevation correlates with a worsening functional status, increased hospitalization rates, and mortality in patients with heart failure.14 Importantly, NT-proBNP levels have been shown to correlate with renal function, as impaired renal clearance in CRS may result in persistently elevated levels, necessitating careful interpretation in cardiorenal patients.15
Despite the availability of these biomarkers, distinguishing acute CRS from AHF remains a clinical challenge because both syndromes share common pathophysiological mechanisms and overlapping biomarker elevations. No single biomarker has demonstrated sufficient specificity to definitively differentiate between these conditions, emphasizing the need for a multimodal biomarker approach.16 This study aimed to evaluate the diagnostic and prognostic utility of plasma L-FABP, hs-TnT, and NT-proBNP levels in distinguishing acute CRS from AHF. By elucidating the interrelationships between renal dysfunction, myocardial stress, and hemodynamic overload, this study seeks to enhance biomarker-based risk stratification, improve early detection strategies, and ultimately optimize patient outcomes in this high-risk population.
2. METHODOLOGY
2.1. Study Design and Participants
This case-control study was conducted at Al-Sadr Teaching Hospital in Najaf, Iraq, from June 2024 to December, 2024, enrolling a total of 90 participants, who were classified into three groups: a control group (n=30) consisting of healthy individuals without a history of cardiovascular or renal disease, an AHF group (n=30) comprising patients diagnosed of AHF, based on clinical presentation and echocardiographic findings, and an acute CRS group (n=30), defined by the presence of both AHF and AKI according to the ‘Kidney Disease: Improving Global Outcomes’ (KDIGO) criteria.17 The study was approved by the Institutional Review Board (No. 34328). All participants provided written informed consent in compliance with the principles of the Declaration of Helsinki.18 The sample size (n) was determined using the following formula to compare two proportions in case-control studies19:
- for a 95% confidence level,
- 0.84 for 80% power,
- 70 (proportion of a specific marker in the PCOS group based on previous studies)
- 30 (proportion in controls).
2.2. Data Collection
Demographic details (age and sex) and relevant medical history were documented. Anthropometric measurements included body mass index (BMI)(22). The clinical assessment included the New York Heart Association (NYHA) functional classification, which was used to evaluate the severity of heart failure symptoms, categorizing patients from Class I (asymptomatic) to Class IV (severe limitation of activity) (23). The left ventricular ejection fraction (EF) was determined using transthoracic echocardiography (TTE) and classified as preserved EF (>50%), mid-range EF (40-49%), and reduced EF (<40%) based on the European Society of Cardiology (ESC) guidelines (24). The duration of hospitalization was also recorded and stratified into two categories, ≤7 days and >7 days, to assess the impact of biomarker levels on patient outcomes (25).
2.3. Sample Collection
Venous blood samples (5–7 mL) were collected from each participant via standard phlebotomy into serum separator tubes (SST) and ethylenediaminetetraacetic acid (EDTA) plasma tubes. Samples were drawn under fasting conditions (if clinically feasible) or at a standardized time point immediately after admission. Tubes were centrifuged at 3,000 × g for 10 min at 4°C, and serum and plasma aliquots were stored at –80°C until assay.
2.4. Biochemical Measurements
Laboratory measurements were performed using venous blood samples collected at the time of hospital admission. Plasma and serum were separated by centrifugation at 1500 × g for 15 min and stored at -80°C until biomarker analysis. Plasma L-FABP levels were measured using an enzyme-linked immunosorbent assay (ELISA) kit (Cat No. LS-F6955, LifeSpan BioSciences, USA) with a detection range of 0.1–50 ng/mL. High-sensitivity Troponin T (hs-TnT) levels were determined using the Elecsys® Troponin T hs assay (Cat No. 05092744 190, Roche Diagnostics, Switzerland), which has a lower detection limit of 5 ng/L and 99th percentile cutoff of 14 ng/L. N-terminal pro-B-type natriuretic peptide (NT-proBNP) was quantified using the Elecsys® pro-BNP II immunoassay (Cat No. 04842464 190, Roche Diagnostics, Switzerland), with a measurement range of 5–35,000 pg/mL. Serum creatinine levels were assessed using a Jaffé kinetic colorimetric assay (Cobas c702, Roche Diagnostics, Switzerland), and the estimated glomerular filtration rate (eGFR) was calculated using the CKD-EPI equation26 as follows:
eGFRcr = 142 × min (Scr/κ, 1) α × max (Scr/κ, 1)-1.200 x 0.9938Age × 1.012 [if female].
In addition to biomarker quantification, complete blood count (CBC), including white blood cell (WBC) count, red blood cell (RBC) count, and hemoglobin (Hb) level, were measured using an automated hematology analyzer (XN-9000, Sysmex, Japan). Serum sodium and potassium concentrations were determined using an ion-selective electrode method (Cobas 6000, Roche Diagnostics, Switzerland).
2.5. Statistical Analysis
The GraphPad Prism 9 software application was used to ascertain the impact of disparate groups (patients versus controls) on the study parameters. The T-test was used to conduct a significant comparison of the means. The Chi-square test was implemented to perform a significant comparison of percentages at the 0.05 and 0.01 probability levels. Estimations of the correlation coefficients and multiple linear regression analyses were conducted for the variables. The sensitivity and specificity of the parameters were evaluated in both the patient and control groups. Cutoff values for the biomarkers were established using Receiver Operating Characteristic (ROC) curve analysis, aimed at optimizing both sensitivity and specificity. The Youden Index was used to determine the optimal threshold for each parameter.27
| Table 1: Comparative demographic, clinical, and laboratory profiles of control, acute heart failure, and acute cardiorenal syndrome groupsa | |||||
| P-value | Acute CRS group
(n = 30) |
AHF group
(n = 30) |
Control group
(n = 30) |
Characteristics | |
| 0.16 O NS | 62.6 ± 7.09 | 62.9 ± 5.6 | 61.5 ± 5.6 | Age (y) | |
| Gender | |||||
| 0.15 F NS | 16 (54) | 14 (46) | 19 (63) | · Male | |
| 11 (37) | 17 (57) | 13 (43) | · Female | ||
| 0.22 O NS | 27.9 ± 1.54 | 25.4 ± 0.84 | 23.7 ± 1.26 | BMI (kg/m²) | |
| Duration of hospitalization | |||||
| < 0.001 F*** | 0 (0.0 ) | 11 (37) | - | · ≤ 7 days | |
| 30 (100 ) | 19 (63) | - | · > 7 days | ||
| NYHH classification | |||||
| < 0.001 F*** | 0 (0.0 ) | 0 (0.0) | - | · Class I | |
| 0 (0.0) | 8 (27) | - | · Class II | ||
| 9 (30 ) | 22 (73) | - | · Class III | ||
| 21 (70 ) | 0 (0.0) | - | · Class IV | ||
| < 0.001 O *** | 32.73 ± 2.49 | 45.70 ± 5.08 | 63.77 ± 4.30 | Ejection fraction | |
| < 0.001 O *** | 30.2 ± 11.4 B | 10.4 ± 4.3 A | 8.6 ± 2.5 A | BUN (mg/dl) | |
| < 0.001 O *** | 1.34 ± 0.08 B | 0.95 ± 0.06 B | 0.75 ± 0.08 A | Baseline serum
creatinine (mg/dl) |
|
| < 0.001 O *** | 2.89 ± 0.53 C | 1.16 ± 0.06 B | 0.84 ± 0.09 A | Current serum
creatinine (mg/dl) |
|
| < 0.001 O *** | 52.1 ± 9.6 C | 70.3 ± 10.3 B | 97.3 ± 13.9 A | eGFR (mL/min) | |
| < 0.001 O *** | 13.6 ± 0.9 C | 11.3 ± 0.8 B | 6.3 ± 1.8 A | WBC (x109/L) | |
| < 0.001 O *** | 3.4 ± 0.32 C | 3.8 ± 0.28 B | 4.9 ± 0.24 A | RBC (x109/L) | |
| < 0.001 O *** | 10.3 ± 0.51 C | 11.3 ± 0.58 B | 14.3 ± 0.6 A | Hb (g/dl) | |
| <0.001 O *** | 132.6 ± 1.4 C | 136.3 ± 0.8 B | 141.5 ± 2.33 A | Sodium (mEq/L) | |
| <0.001 O *** | 5.04 ± 0.27 C | 4.2 ± 0.11 B | 4.01 ± 0.33 A | Potassium (mEq/L) | |
| LEGEND: Data given as Mean ± SD or n (); O: one-way ANOVA; NS: not significant (p ≥ 0.05); F: Fisher's exact test; ***: significant at P < 0.001. Capital letters A, B, and C indicate the level of significance following Tukey's multiple comparisons test; similar letters indicate no significant difference, whereas different letters indicate significant differences. | |||||
3. RESULTS
Demographic, clinical, and laboratory parameters are compared across the three groups. There were no significant intergroup differences in age, sex distribution, or BMI (all P > 0.05) (Table 1). However, both the duration of hospitalization and NYHA functional classes differed notably, with acute CRS patients all having longer stays (>7 days) and more severe NYHA classes compared to the AHF group (P < 0.001). EF progressively declined from control (63.77 ± 4.30%) to AHF (45.70 ± 5.08%) to acute CRS group (32.73 ± 2.49%; P < 0.001), reflecting worsening cardiac function (Table 1).
Renal indices (BUN, serum creatinine, and eGFR) were significantly altered among the three groups, with the most pronounced renal impairment observed in acute CRS group (all P < 0.001). Similarly, WBC counts were the highest and RBC counts the lowest in the acute CRS group (both P < 0.001), indicating heightened inflammatory status and possible anemia. Hb values were also significantly reduced in both AHF and CRS compared to controls (P < 0.001). Lastly, serum sodium and potassium levels varied markedly, with lower sodium and higher potassium in acute CRS, suggestive of notable electrolyte disturbances (P < 0.001).
| Table 2. Comparative Levels of study bionarkers in Control, AHF, and Acute CRS Groups | ||||
| P-value | Acute CRS group
(n = 30) |
AHF group
(n = 30) |
Control group
(n = 30) |
Biochemical Parameter |
| < 0.001 O *** | 832 ± 83 C | 611 ± 101 B | 10.6 ± 1.9 A | hs-TnT (pg/mL) |
| < 0.001 O *** | 9.1 ± 1.5 C | 6.34 ± 1.32 B | 0.19 ± 0.05 A | NT-proBNP (ng/mL) |
| < 0 .001 O *** | 25.5 ± 5.2 C | 10.7 ± 5.7 B | 5.04 ± 0.8 A | Plasma L-FABP (ng/mL) |
| LEGEND: a n: number of cases; SD: standard deviation; O: one-way ANOVA; ***: significant at P < 0.001. Capital letters A, B, and C were used to indicate the level of significance following Tukey's multiple comparisons test; similar letters indicate no significant difference, whereas different letters indicate significant differences. | ||||
| Table 3: Association of biomarkers with hospitalization duration a | ||||
| Characteristic | Hospitalization | Mean Difference | P-value | |
| ≤ 7 days (n = 19) | > 7 days (n = 41) | |||
| Plasma L-FABP (ng/mL) | 11.58 ± 5.74 | 21.20 ± 8.80 | -9.62 | < 0.001 I *** |
| hs-TnT (pg/mL) | 612.53 ± 107.04 | 772.55 ± 132.03 | -160.02 | < 0.001 I *** |
| NT-proBNP (ng/mL) | 6.00 ± 1.23 | 8.50 ± 1.74 | -2.50 | < 0.001 I *** |
| Data given as Mean ± SD; a n: number of cases; I: independent T test; ***: significant at P < 0.001. | ||||
| Table 4: Receiver Operating Characteristic (ROC) Curve Analysis for Biomarkers in Differentiating Acute CRS from AHF | ||||||||
| Variable(s) | AUC | Std. Error | P-value | 95% Confidence Interval | Cutoff | Sens | 1 - Spec | |
| Plasma L-FABP (ng/mL) | 0.968 | 0.023 | > 0.001*** | 0.923 | 1.013 | 17.9800 | 0.967 | 0.067 |
| hs-TnT (pg/mL) | 0.958 | 0.023 | > 0.001*** | 0.913 | 1.002 | 738.6450 | 0.900 | 0.100 |
| NT-proBNP (ng/mL) | 0.913 | 0.036 | > 0.001*** | 0.843 | 0.983 | 7.9650 | 0.800 | 0.067 |
| aSens: Sensitivity; Spec: Specificity; AUC: area under curve | ||||||||
| Table 5: Multiple linear regression analyses of biomarkers predicting current creatinine levelsa | ||||
| Current creatinine independent variables | Dependent variables | |||
| B (Coefficient) | Std. Error | t-value | P-value | |
| Plasma L-FABP (ng/mL) | 0.532 | 0.001 | 3.404 | 0.001 |
| hs-TnT (pg/mL) | 0.089 | 0.001 | 0.975 | 0.334 |
| NT-proBNP (ng/mL) | 0.110 | 0.038 | 1.243 | 0.219 |
| Model (R2 = 0.811) F-ratio (46.325) The model is statistically significant (P < 0.001).
a B (coef): Regression Coefficient; Dependent Variable: Current Creatinine |
||||
In Table 2 all three measured biomarkers—Hs‐TnT, NT‐proBNP, and plasma L‐FABP—demonstrated highly significant differences among the control, AHF, and acute CRS groups (P < 0.001). Hs-TnT and NT‐proBNP, both indicators of cardiac stress, showed stepwise elevations from control to AHF and reached their highest levels in acute CRS. A similar trend emerged for plasma L‐FABP, with markedly increased concentrations in acute CRS compared to both AHF and controls. As illustrated in Figure 1, multiple comparison testing confirmed that the mean plasma L‐FABP differences between each pair of groups (control vs. AHF, control vs. CRS, and AHF vs. CRS) were statistically significant, reflecting a clear gradient of rising biomarker levels in the setting of worsening cardiac and renal dysfunction.
Table 3 reveals a significant association between prolonged hospitalization (>7 days) and elevated levels of Plasma L-FABP, hs-TNT, and NT-proBNP (P < 0.001).
Patients with extended hospitalization had markedly higher Plasma L-FABP, hs- TNT, and NT-proBNP compared to those hospitalized for ≤ 7 days.
Figure 2A reveals a strong, positive correlation (r = 0.840) between plasma L‐FABP and current serum creatinine levels, indicating that rising L‐FABP concentrations are closely associated with increased renal impairment. In contrast, Figure 2B demonstrates a moderate, negative correlation (r = −0.550) between plasma L‐FABP and eGFR, suggesting that higher L‐FABP values coincide with diminishing glomerular filtration rates.
In Table 4, plasma L‐FABP demonstrated the highest diagnostic accuracy for distinguishing acute CRS from acute AHF, with an AUC of 0.968 (P < 0.001). By comparison, hs-TnT (AUC = 0.958) and NT‐proBNP (AUC = 0.913) also showed excellent performance (P < 0.001 for both). The cutoff values derived for each biomarker (17.98 ng/mL for L‐FABP, 738.65 pg/mL for hs-TnT, and 7.97 ng/mL for NT‐proBNP) yielded high sensitivities (0.80–0.97) and specificities (0.90–0.93).
Table 5 show multiple linear regression model incorporating plasma L‐FABP, hs-TnT, and NT‐proBNP explained 81 of the variance in current serum creatinine (R² = 0.811; F = 46.325; P < 0.001). Of the three biomarkers, only plasma L‐FABP emerged as a statistically significant independent predictor of creatinine levels (B = 0.532, P = 0.001), indicating that rising L‐FABP is strongly associated with higher creatinine. In contrast, hs-TnT (B = 0.089, P = 0.334) and NT‐proBNP (B = 0.110, P = 0.219) did not significantly contribute to the model. The overall model was highly significant (R² = 0.811, F-ratio = 46.325, P < 0.001), indicating that these biomarkers collectively explained a substantial proportion of creatinine variability, with plasma L-FABP being the most influential predictor.
4. DISCUSSION
The intricate pathophysiology underlying CRS involves hemodynamic alterations, neurohormonal activation, inflammation, oxidative stress, and endothelial dysfunction, all of which create a vicious cycle of worsening organ function (28). Given the high morbidity and mortality associated with CRS, the identification of reliable biomarkers for early diagnosis, risk stratification, and prognosis is of paramount importance.29 Our study underscores the pivotal role of plasma L‐FABP in delineating the complex pathophysiology of AHF and acute CRS. By demonstrating a stronger association with renal function indices (serum creatinine and eGFR) than either hs-TnT or NT‐proBNP, L‐FABP appears to provide a more direct measure of tubular integrity in the context of acute cardiac decompensation. Furthermore, the superior diagnostic accuracy of L‐FABP in differentiating CRS from AHF adds to a growing body of literature that positions L‐FABP as a potent, renal‐focused biomarker in the cardiorenal continuum.30
Mechanistically, L‐FABP is an intracellular chaperone, binding and stabilizing free fatty acids, reducing their potential to undergo peroxidation and generate reactive oxygen species (ROS).9 Under normal circumstances, the kidney’s proximal tubule derives a substantial portion of its energy from β‐oxidation of fatty acids; however, in conditions of low perfusion pressure or increased venous congestion—both hallmarks of acute or chronic heart failure—tubular cells experience ischemia, leading to an accumulation of partially oxidized fatty acids and subsequent cellular injury.31 In response, L‐FABP expression rises in proximal tubular cells, and excess L‐FABP is released into the bloodstream (or urine), thus serving as a real‐time gauge of tubular stress.32 Beyond its role as a marker, some reports suggest that L‐FABP may also mitigate further lipid peroxidation damage; however, persistent hemodynamic derangements can overwhelm this protective mechanism, resulting in continued renal function decline.10
Importantly, while hs-TnT and NT‐proBNP reflect myocardial injury and wall stress, respectively, they do not specifically address renal tubular pathology. As such, our regression analysis showing that only L‐FABP contributed significantly to predicting serum creatinine highlights a missing piece in standard AHF biomarker panels. The data bolster the concept that CRS is driven by a culmination of myocardial dysfunction, neurohormonal dysregulation, and direct tubular injury, each best captured by different—but complementary—biomarkers.33 This comprehensive approach resonates with the “multi‐organ heart failure” framework proposed in recent literature, which advocates for monitoring markers that reflect stress on both the heart and kidneys.16
One of the key findings of this study was the superior diagnostic accuracy of plasma L-FABP in distinguishing CRS from AHF, with an ROC AUC of 0.968. This finding is particularly significant, given that early differentiation between CRS and AHF is critical for optimizing treatment strategies. Combining L-FABP with NT-proBNP further improved the diagnostic precision, supporting previous research demonstrating that multi-marker approaches enhance early CRS detection. Elevated hs-TnT and NT-proBNP levels were significantly associated with prolonged hospitalization (>7 days) and increased disease severity, reinforcing their value as predictors of adverse clinical outcome. These results were consistent with those reported by Alhejily and Tan, Chan, who reported that elevated natriuretic peptides and troponins predict readmission risk and mortality in populations with heart failure.34, 35
Our findings align with earlier work by Naruse, Ishii, which demonstrated a robust correlation between L‐FABP and acute kidney injury severity.10 These authors noted that urinary L‐FABP levels reflected early tubular stress long before significant changes in serum creatinine were observed. Although our study focused on plasma L‐FABP, the mechanistic underpinning remains highly relevant: increased oxidative stress and lipid peroxidation in the proximal tubule lead to greater expression and release of L‐FABP.32 Similarly, Tang, Bakitas highlighted the profound influence of renal congestion and reduced forward perfusion on kidney injury in advanced heart failure.36 Our data support their proposition that interventions reducing venous pressure and enhancing cardiac output may concurrently alleviate tubular cell stress, reflected by a potential decline in L‐FABP concentrations. Several groups have also emphasized how CRS is not merely a unidirectional process of “heart failing the kidney” but rather an intricate interplay wherein kidney‐derived factors, such as heightened inflammatory mediators and neurohormonal signals, can aggravate cardiac dysfunction.33 This bidirectional crosstalk may help explain why conventional cardiac markers (hs-TnT, NT‐proBNP) alone do not fully capture the severity of CRS, whereas L‐FABP offers a more integrated view of tubulointerstitial pathology tied to hemodynamic compromise.
Clinically, our findings point to L‐FABP as a powerful early‐warning marker of renal compromise in patients with AHF, where even subclinical tubular damage may set the stage for progressive CRS. Early detection using L‐FABP could prompt more aggressive interventions, such as optimizing volume management to alleviate congestion, intensifying neurohormonal blockade, or employing device therapy to bolster cardiac output if needed.37 Indeed, Spring, Marsela showed that decongestive strategies aimed at lowering right atrial pressure can slow the trajectory of renal deterioration, presumably by reducing venous back‐pressure on the kidneys.38 While serum creatinine and eGFR remain the conventional indices, they are often late or insensitive indicators of kidney injury; incorporating L‐FABP measurements could refine risk stratification by identifying patients at immediate risk of renal deterioration before it becomes clinically evident.
Another practical consideration is monitoring treatment response. Given that L‐FABP levels rise and fall in tandem with tubular cell injury, serial measurements may track acute on chronic kidney insults in real time, thus enabling personalized, dynamic management. Future research should seek to determine if a decline in L‐FABP during therapy correlates with clinically meaningful outcomes, such as shorter hospital stays or reduced mortality in CRS.
5. LIMITATIONS
This study has several limitations, including the small sample size, which may limit the generalizability and observational design, preventing causal inferences. The lack of longitudinal biomarker measurements limits our understanding of dynamic changes over time. Additionally, potential confounders, such as comorbidities (e.g., diabetes and chronic kidney disease), may have influenced the biomarker levels. Finally, as a single-center study, multicenter validation with larger cohorts is needed to confirm these findings and support clinical integration.
6. Future Directions
Future research should prioritize large-scale multicenter studies to validate the superior diagnostic performance of plasma L-FABP in differentiating CRS from AHF. Longitudinal studies are needed to assess the prognostic value of hs-TnT and NT-proBNP levels in predicting disease progression and treatment response. Additionally, integrating plasma L-FABP with novel renal biomarkers, such as NGAL and KIM-1, could enhance the early detection of AKI in CRS. Further investigations should explore biomarker-guided treatment strategies, using serial NT-proBNP measurements to optimize diuretic therapy and hs-TnT trends to assess myocardial stress and guide cardioprotective interventions in CRS management.
7. CONCLUSION
Our study reinforces the distinct pathophysiological significance of L‐FABP in AHF and CRS, demonstrating its strong correlation with renal dysfunction, potent discriminative ability for CRS, and independence from traditional cardiac markers. These data suggest that L‐FABP captures the intricate interplay of ischemic, congestive, and metabolic insults to the kidney in the setting of compromised cardiac function. Integrating L‐FABP measurement into standard practice could profoundly enhance early risk stratification, enabling the timely implementation of targeted strategies that protect renal function and potentially improve the overall prognosis of patients with CRS.
8. Acknowledgments
We extend our sincere gratitude to all participants who volunteered for this study, without whom this research would not have been possible. Our heartfelt thanks go to the medical and nursing staff at the Al-Sadr Teaching Hospital in Najaf, Iraq, for their invaluable assistance in patient recruitment and sample collection.
9. REFERENCES
- Schmucker J, Lutz J, Fach A, Osteresch R, Ruehle S, Hambrecht R, et al. Cardio-renal syndromes in patients admitted with ST-elevation myocardial infarctions: incidence and impact on renal and overall outcome. Eur Heart J. 2024;45(Suppl 1):ehae666.1679. DOI: 1093/eurheartj/ehae666.1679
- Tanwar P, Naagar M, Malik G, Alam MS, Singh T, Singh O, et al. Relationship between right heart failure and cardio-renal syndrome: a review. 2023. [FreeFullText]
- Méndez AB, Azancot MA, Olivella A, Soler MJ. New aspects in cardiorenal syndrome and HFpEF. Clin Kidney J. 2022;15(10):1807-15. [PubMed] DOI: 1093/ckj/sfac133
- Graziani G, Pini D, Oldani S, Cucchiari D, Podestà MA, Badalamenti S. Renal dysfunction in acute congestive heart failure: a common problem for cardiologists and nephrologists. Heart Fail Rev. 2014;19:699-708. [PubMed] DOI: 1007/s10741-013-9416-5
- Beige J, Masanneck M. (Prote)omics for superior management of kidney and cardiovascular disease—a thought-provoking impulse from nephrology. Proteomics. 2024:e202400143. [PubMed] DOI: 1002/pmic.202400143
- Haller PM, Goßling A, Magnussen C, Brenner H, Schöttker B, Iacoviello L, et al. Biomarker-based prediction of fatal and non-fatal cardiovascular outcomes in individuals with diabetes mellitus. Eur J Prev Cardiol. 2023;30(12):1218-26. [PubMed] DOI: 1093/eurjpc/zwad122
- Delalić Đ, Brežni T, Prkačin I. Diagnostic value and utility of commonly used biomarkers of cardiac and renal function in cardiorenal syndromes: a narrative review. Biochem Med. 2023;33(3):242-54. [PubMed] DOI: 11613/BM.2023.030502
- Wejnaruemarn S, Prasoppokakorn T, Srisawat N, Teerasarntipan T, Thanapirom K, Phathong C, et al. Urine liver-type fatty acid-binding protein; biomarker for diagnosing acute kidney injury and predicting mortality in cirrhotic patients. Siriraj Med J. 2024;76(4):198–208. DOI: 33192/smj.v76i4.268004
- Sun T, Qu S, Huang T, Ping Y, Lin Q, Cao Y, et al. Rapid and sensitive detection of L‐FABP for prediction and diagnosis of acute kidney injury in critically ill patients by chemiluminescent immunoassay. J Clin Lab Anal. 2021;35(11):e24051. [PubMed] DOI: 1002/jcla.24051
- Naruse H, Ishii J, Takahashi H, Kitagawa F, Nishimura H, Kawai H, et al. Urinary liver-type fatty-acid-binding protein predicts long-term adverse outcomes in medical cardiac intensive care units. J Clin Med. 2020;9(2):482. [PubMed] DOI: 3390/jcm9020482
- Giannitsis E, Frey N, Katus HA. Natriuretic peptides and cardiac hs-troponins as surrogates of cardiomyocyte stress—clinical value in HCM? Eur Heart J. 2024;45(42): [PubMed] DOI: 10.1093/eurheartj/ehae600
- Noorayingarath H, Panjiyar BK, Gela I, Ramalingam L. Role of cardiac troponins in predicting adverse outcomes in acute coronary syndrome with renal dysfunction. Cureus. 2023;15(10). [PubMed] DOI: 7759/cureus.47104
- Dsouza G, Sharma M. NT-proBNP in heart failure with preserved ejection fraction: a comprehensive review. Indian J Clin Cardiol. 2024;5(4):372-84. DOI: 1177/26324636241261422
- Schmitt W, Rühs H, Burghaus R, Diedrich C, Duwal S, Eissing T, et al. NT‐proBNP qualifies as a surrogate for clinical end points in heart failure. Clin Pharmacol Ther. 2021;110(2):498-507. [PubMed] DOI: 1002/cpt.2222
- Faraj HR. Serum NT-proBNP and other biochemical markers in patients with cardiorenal syndrome in Thi-Qar province-Iraq. J Biosci Appl Res. 2024;10(4):686-94. DOI: 21608/jbaar.2024.311161.1064
- Dutta A, Saha S, Bahl A, Mittal A, Basak T. A comprehensive review of acute cardio-renal syndrome: need for novel biomarkers. Front Pharmacol. 2023;14:1152055. [PubMed] DOI: 3389/fphar.2023.1152055
- Kellum JA, Lameire N, Aspelin P, Barsoum RS, Burdmann EA, Goldstein SL, et al. KDIGO clinical practice guideline for acute kidney injury. Kidney Int Suppl. 2012;2(1):1-138. [FreeFullText]
- Shrestha B, Dunn L. The Declaration of Helsinki on Medical Research involving Human Subjects: A Review of Seventh Revision. J Nepal Health Res Counc. 2020;17(4):548-552. [PubMed] DOI: 33314/jnhrc.v17i4.1042
- Gail MH, Haneuse S. Power and sample size for case-control studies. Handbook of Statistical Methods for Case-Control Studies. Chapman and Hall/CRC; 2018. p. 163-88.
- Mitsas AC, Elzawawi M, Mavrogeni S, Boekels M, Khan A, Eldawy M, et al. Heart failure and cardiorenal syndrome: a narrative review on pathophysiology, diagnostic and therapeutic regimens—from a cardiologist’s view. J Clin Med. 2022;11(23):7041. [PubMed] DOI: 3390/jcm11237041
- Baumgartner H, De Backer J. The ESC clinical practice guidelines for the management of adult congenital heart disease. Eur Heart J. 2020;41(43):4153-4154. [PubMed] DOI: 1093/eurheartj/ehaa701
- Silverman MP. Exact statistical distribution of the body mass index (BMI): analysis and experimental confirmation. Open J Stat. 2022;12(3). DOI: 4236/ojs.2022.123022
- Bredy C, Ministeri M, Kempny A, Alonso-Gonzalez R, Swan L, Uebing A, et al. NYHA classification in adults with congenital heart disease: relation to exercise and outcome. Eur Heart J Qual Care Clin Outcomes. 2018;4(1):51-8. [PubMed] DOI: 1093/ehjqcco/qcx031
- Alem MM. Clinical, echocardiographic, and therapeutic characteristics of heart failure with preserved, mid-range, and reduced ejection fraction: future directions. Int J Gen Med. 2021:459-67. [PubMed] DOI: 2147/IJGM.S288733
- Rychik J, Ayres N, Cuneo B, Gotteiner N, Hornberger L, Spevak PJ, et al. ASE guidelines and standards for performance of the fetal echocardiogram. J Am Soc Echocardiogr. 2004;17(7):803-10. [PubMed] DOI: 1016/j.echo.2004.04.011
- Inker LA, Eneanya ND, Coresh J, Tighiouart H, Wang D, Sang Y, et al. New creatinine- and cystatin C–based equations to estimate GFR without race. N Engl J Med. 2021;385(19):1737-49. [PubMed] DOI: 1056/NEJMoa2102953
- George D, Mallery P. IBM SPSS Statistics 26 step by step: a simple guide and reference. Routledge; 2019.
- Ajibowo AO, Okobi OE, Emore E, Soladoye E, Sike CG, Odoma VA, et al. Cardiorenal syndrome: a literature review. Cureus. 2023;15(7). [PubMed] DOI: 7759/cureus.41252
- Ullah A, Sajid S, Qureshi M, Kamran M, Anwaar M, Naseem M, et al. Novel biomarkers and the multiple-marker approach in early detection, prognosis, and risk stratification of cardiac diseases: a narrative review. Cureus. 2023;15:e42081. [PubMed] OI: 7759/cureus.42081
- Chiang TH, Yo CH, Lee GH, Mathew A, Sugaya T, Li WY, et al. Accuracy of liver-type fatty acid-binding protein in predicting acute kidney injury: a meta-analysis. J Appl Lab Med. 2022;7(2):421-36. [PubMed] DOI: 1093/jalm/jfab092
- Gewin L. Sugar or fat? Renal tubular metabolism reviewed in health and disease. Nutrients. 2021;13:1580. [PubMed] DOI: 3390/nu13051580
- Katayama M, Ohata K, Miyazaki T, Katayama R, Wakamatsu N, Ohno M, et al. Renal expression and urinary excretion of liver‐type fatty acid‐binding protein in cats with renal disease. J Vet Intern Med. 2020;34(2):761-9. [PubMed] DOI: 1111/jvim.15721
- Chung EY, Trinh K, Li J, Hahn SH, Endre ZH, Rogers NM, et al. Biomarkers in cardiorenal syndrome and potential insights into novel therapeutics. Front Cardiovasc Med. 2022;9:868658. [PubMed] DOI: 3389/fcvm.2022.868658
- Alhejily WA. High sensitivity troponins in patients with elevated prohormone of beta natriuretic peptide and acute heart failure (HIGH TRIP Trial). Sci Rep. 2022;12(1):1838. [PubMed] DOI: 1038/s41598-022-05759-x
- Tan ES, Chan SP, Liew OW, Chong JP, Gerard Leong KT, Daniel Yeo PS, et al. Differential associations of A-/B-type natriuretic peptides with cardiac structure, function, and prognosis in heart failure. Heart Fail. 2024;12(3):461-74. [PubMed] DOI: 1016/j.jchf.2023.09.011
- Tang WW, Bakitas MA, Cheng XS, Fang JC, Fedson SE, Fiedler AG, et al. Evaluation and management of kidney dysfunction in advanced heart failure: a scientific statement from the American Heart Association. Circulation. 2024;150(16):e280-e95. [PubMed] DOI: 1161/CIR.0000000000001273
- Agarwal M, Pakhare SN. Emerging therapeutic strategies in heart failure management: a narrative review of current evidence and future directions. Int J Cardiol Sci. 2024;6(1):32-8. DOI: 33545/26649020.2024.v6.i1a.47
- Spring AM, Marsela E, Jorde UP. Early experience with devices that reduce kidney vascular afterload from the veins. J Card Fail. 2024;30(7):961-963. [PubMed] DOI: 1016/j.cardfail.2024.02.005