Noha A. Afify 1, Yasser E. Fathi 1, Mohamed A. Ghanem 3, Nagwa I. Mowafy, Nadia M. Bahgat 1
Author affiliations:
Background & objective: Liver cirrhosis has been associated with an elevated risk of perioperative complications and the development of post-induction hypotension (PIH). The purpose of this research was to determine how well changes in the internal jugular vein) IJV (diameter and area can predict post-induction hypotension in cirrhotic patients.
Methodology: A prospective study was conducted in 96 cirrhotic patients, undergoing general anesthesia for surgery, at Department of Anesthesia, Menoufia University hospitals, from October 2023 to September 2024. IJV diameter, area, collapsibility index in supine and Trendelenburg positions and IJV change rate measurements were recorded. A decrease in mean arterial pressure (MAP) by more than 20% of the baseline was defined as ‘hypotension’. A persistent hypotension for ≥ 2 min was defined as ‘prolonged hypotension’. If MAP was reduced by over 40% from the baseline value, it was considered as ‘severe hypotension’.
Results: Hypotension occured in 68% of the participants studied. There was no statistically significant difference between hypotensive and non-hypotensive groups regarding age, sex and baseline mean blood pressure. Δ IJV maximum diameter, ΔIJV minimum diameter, ΔIJV -A, ΔIJV-CI with cut-off point (≥ 0.14, ≤ 0.10, ≥ 0.22, ≥ 0.21 respectively) and sensitivity and specificity of (81% and 97%/ 67% and 77% / 100% and 90% / 78% and 90% respectively) in prediction of hypotension
Conclusion: The ultrasound guided measurement of IJV parameters demonstrated a good diagnostic accuracy during both the supine and Trendelenburg position for predicting postinduction hypotensive response especially, the change rate of IJV area.
Keywords: Internal Jugular Vein; Ultrasonographic Measurement; Hypotension; General Anesthesia; Induction
Citation: Afify NA, Fathi YE, Ghanem MA, Mowafy NI, Bahgat NM. Anaesth. pain intensive care; 2025;29(2):270-277. DOI: 10.35975/apic.v29i2.2715
Received: May 09, 2024; Reviewed: October 26, 2024; Accepted: January 01, 2025
Intraoperative hypotension is a condition that has a significant impact on the risk of 30-day mortality, one-year mortality, septic complications, myocardial injury, and acute renal injury in specific patient populations following noncardiac surgery. This condition lacks a universal definition. Preventing an unwanted hypotensive event is crucial for ensuring patient safety. In order to assist clinicians in identifying patients with a modifiable risk level, such as those with impaired preload, it is necessary to identify readily accessible variables.1,2
Volume responsiveness can be predicted by observing how the respiratory cycle affects the variability of the inferior vena cava (IVC) diameter in patients who are on ventilate and breathing on their own but are experiencing circulatory failure, even with nonfatal cardiac arrhythmias. This discovery has implications for the status of volemics. A clinically significant response to bolus fluid administration was considered to be volume responsive in these studies if cardiac output increased by at least 10%.3-5
The objective of the current investigation was to identify patients who were at risk of hypotensive events associated with general anesthesia (GA) in a hemodynamically stable population by evaluating the IJV measurements as a potential screening tool.
A prospective double‑blinded controlled trial was conducted during the period from October 2023 to September 2024. The study was started after obtaining the approval of the research ethics committee provided by the Ethical Committee (approval number 10/2023 ANET 24 dated October 2023). It was prospectively registered in the Pan‑African Clinical Trials Registry (PACTR202406533026468) and performed in accordance with the principles of Helsinki declaration.
Child A and B were cirrhotic patients who were scheduled for elective abdominal surgeries that were part of the study. Male and female patients aged 20-60 with a body mass index (BMI) <35 kg/m2.
Morbidly obese patients with BMI >35 kg/m2, a history of cardiac disease, uncontrolled diabetes mellitus, hypertension, pulmonary, or endocrine diseases, renal impairment, pregnancy and emergency surgery, history of radiotherapy or surgery of the neck region, acute liver failure and liver cancers, patients on beta blockers, ACE inhibitors or Angiotensin II receptor blockers (ARBs) , and/or not willing to participate in the study were excluded. A written informed consent was obtained from every patient.
The patient's vital signs, including oxygen saturation (SpO2), non-invasive blood pressure (NIBP), and continuous electrocardiography (ECG), were set up in the operating room on arrival. An 18-gauge cannula was inserted into a peripheral vein to establish a ringer lactate infusion @ 7 mL/kg/h.
The patient was supine and breathing spontaneously at the time of the IJV examination. Ultrasound measurements were conducted with a linear probe on Sonosite-Nanomax ultrasound system, Bothell-USA. The level of the cricoid cartilage was used for all measurements. The initial application of the ultrasound gel was to the side of the neck. Following the application of manual pressure to compress the IJV, a vascular transducer was placed delicately on the neck to differentiate it from the common carotid artery. The IJV area (mm2) and maximum and minimum IJV diameters (dIVCmax and dIVCmin, respectively) were measured at the conclusion of each breathing cycle using M-mode imaging.
The collapsibility index (CI) was calculated using the following formula: CI = (dIVCmax - dIVCmin)/dIVCmax, expressed as percentage. Then the patient was relocated to the 10° Trendelenburg position, and the ultrasonographic measurements were conducted in the same manner. All IJV measurements were conducted by the same senior anesthesiologist.
A second anesthesiologist, who was unaware of the sonographic measurements, induced anesthesia gave 2 mg/kg of propofol and 2 μg/kg of fentanyl intravenously. 0.5 milligrammes per kilogramme of atracurium. Isoflurane 1.2 percent on an oxygen/air mixture with 0.5 percent FiO2 and 0.25 mg/kg of atracurium were used to maintain anesthesia after oral endotracheal intubation, with the help of a TOF guard. With an ETCO2 goal of 35–40 mmHg, the patients were mechanically ventilated. Isoflurane MAC was adjusted so that BIS remained between 40 and 50.
Cardiopulmonary measurements (HR, MAP, and SpO2) were monitored before induction and then every minute for the first fifteen minutes after induction. A drop in mean arterial pressure (MAP) below 20% compared to the baseline value was deemed hypotension. Severe hypotension (MAP decline exceeding 60%) or persistent hypotension (MAP drop lasting 2 minutes or more)
With this definition in hand, we were able to divide our patients into two groups: the hypotensive group and the non-hypotensive group. Hypotensive episodes were treated with 5 mg of ephedrine and heart rate drops below 50 beats per minute with 0.5 mg of atropine. A five microgramme norepinephrine bolus was administered if hypotension persisted despite three consecutive doses of ephedrine or if MAB decease exceeded 60% of baseline.
The purpose of this research was to determine whether there was a correlation between alterations in cirrhotic patients' postinduction hypotension and sizes of their internal jugular veins. Additional results included the collapsibility index, maximum and minimum diameters, and area of the intrajugular vein (IJV) measured in both the supine and Trendelenburg positions. There was also a record of severe hypotension that lasted for a long time after induction.
Sample Size calculation:
according to a review of previous literature (6) The researchers discovered a rate of change (%) in IJV area with an area under the ROC curve of 0.909 (95% CI, 0.833, 0.985), indicating a high degree of discrimination between patients who would develop post-spinal hypotension and those who would not using statistics and version 6 of the sample size preprogram, we were able to determine that 96 subjects would be the minimum sample size. There was an 80% power of the investigation, and the confidence level was 95%.
On an IBM compatible computer, the data was tabulated and analysed using SPSS (Statistical Package for the Social Science) version 26.
Descriptive statistics: number and percentage were expressed (No & %) for qualitative data and mean& SD and range for quantitative data.
Analytic statistics: Qualitative variables were analyzed using Pearson Chi-squared test (χ2) and Fisher exact test, while the quantitative normally distributed variables analyzed using Student t test (t).With the use of receiver operating characteristic (ROC) curve analysis, we sought to ascertain whether IJV measurements could foretell clinically significant post-induction hypotension. To determine the AUC, 95% confidence intervals were utilised. Every parameter's sensitivity, specificity, and optimal cutoff value were calculated.
We excluded 14 patients out of 110 who did not meet our eligibility criteria. A total of 96 patients' data sets were examined. The demographic profile (including age, sex, and baseline vital signs, was similar for patients with hypotension and those without it (Table 1). Hypotension occurred in 65 (68%) patients following anesthesia induction, with 2 (3.1%) patients developing severe or persistent hypotension. All hypotensive patients received ephedrine, only 2 patients required additional doses of norepinephrine (Table 2).
IJV parameters (maximum and minimum diameters, maximum area, and collapsibility index) were compared between the hypotensive and non-hypotensive groups whether in supine position (P = 0.003-0.001) or Trendelenburg position (P = 0.023-0.001). Patients who experienced postinduction hypotension had a significantly lower rate of change (P < 0.001) in the measurements with position compared to those who did not (Table 3).
The studied parameters were found to have good diagnostic accuracy in the supine position according to the ROC curve analysis, with AUC values of 0.67 (95% confidence interval = 0.56-0.78; P = 0.007), 0.91 (95% confidence interval = 0.84-0.97; P = 0.001), 0.72 (95% confidence interval = 0.61-0.84; P = 0.001), and 0.98 (95% confidence interval= 0.97-1.000; P < 0.001), respectively. The optimum cut‑off value of IJVmax, IJVmin, IJVarea, and collapsibility index was ≤ 1.59 cm (sensitivity 66%; specificity 52%), ≤ 1.33 cm (sensitivity 83%; specificity 81%), ≤ 1.85 cm (sensitivity 77%; specificity 61%), and ≥ 14.05 cm (sensitivity 100%; specificity 77%) (Figure 1).
The ROC curve analysis also showed that the studied parameters were accurate diagnostic indicators in the Trendelenburg position, with AUC values of 0.52 (95% CI: 0.41-0.64; P = 0.719), 0.93 (95% CI: 0.87-0.98; P < 0.001), 0.60 (95% CI: 0.48-0.72; P = 0.111), and 0.995 (95% CI: 0.99-1.000; P < 0.001), respectively. There was an optimal cut off value of ≤1.82 cm for IJVmax, ≤1.48 cm for IJVmin, ≥ 2.32 cm for IJVarea, and ≥16.5 cm for the collapsibility index, with sensitivity 52% and specificity 48%, sensitivity 51% and specificity 61%, and 100% and 71%, respectively (Table 4).
The area under the curve (AUC) for the rate of change in the studied parameters with respect to position was 0.91 (95% confidence interval= 0.85-0.97; P < 0.001) for IJVmax, 0.73 (95% confidence interval = 0.63-0.83; P < 0.001) for IJVmin, 0.98 (95% confidence interval= 0.96-1.000; P < 0.001) for IJVarea, and 0.87 (95% confidence interval= 0.81-0.94; P < 0.001) for collapsibility index, respectively. The optimum cut‑off value of IJVmax, IJVmin, IJVarea, and collapsibility index was ≥ 0.14cm (sensitivity 81%; specificity 97%), ≤ 0.10 cm (sensitivity 67%; specificity 77%), ≥ 0.22cm (sensitivity 100%; specificity 90%), and ≥ 0.21cm (sensitivity 78%; specificity 90%) respectively (Figure 2).
The assessment of intravascular volume status continues to be a significant and difficult issue. The volume status is evaluated by combining clinical examination, radiography, and laboratory parameters. However, latent hypovolemia may remain undetected due to its potential to affect organ perfusion and haemodynamics.7
We know a lot about the cardiovascular and vascular complications of cirrhosis. Nitric oxide and other vasoactive molecules cause progressive splanchnic and systemic vasodilation in response to endothelial stretching and stress caused by portal hypertension. Therefore, the hyperdynamic condition continues and the effective central blood volume remains low. Hence, substantial hypotension and decompensation can result from any degree of insult to this system.8,9
During the induction of GA, there is a decrease in peripheral sympathetic tone and a depression of the cardiovascular system, leading to hypotension after the procedure. Conditions such as hypovolaemia and preexisting organ dysfunction can worsen this hypotensive response.10
The evaluation of great veins, including IVC and IJV, using sonography to determine intravascular volume status is becoming increasingly common in acute care settings for tasks such as regional blocks and intravascular volume debt. This is a new area of application for real-time ultrasonography.11,12
Previous studies used a battery of sonographic IJV measurements to identify variables that predicted fluid responsiveness, central venous pressure, and intravascular volume status.13-16
Hypotension during GA induction was the target of this study, which sought to evaluate the diagnostic accuracy of IJV parameters derived from ultrasound in predicting this event. We used a standard method for measuring these parameters and enrolled adult patients with cirrhosis who did not have any clinical predictors.
The present study found 68% of cirrhotic patients developed postinduction hypotension with no preoperative clinical predictors. The ultrasound guided measurement of IJV parameters (IJVmax, IJVmin, IJV area, and CI) demonstrated good diagnostic accuracy during both the supine and Trendelenburg position for predicting this hypotensive response. IJV area was a better predictor for postinduction hypotension than other parameters.
Patients with postinduction hypotension had smaller IJV as measured in the supine and Trendelenburg positions. Hence, those who experienced postinduction hypotension had noticeably higher ΔIJVmax, ΔIJVmin, ΔIJVarea, and ΔIJV CI compared to those who suffered no such thing. comparable to the effect of passive leg raising on shocked patients, demonstrating the rapid transition from supine to Trendelenburg position of the IJV-D. This could suggest a change in intravascular volume. This change can be useful for predicting latent hypovolemia and, by extension, postinduction hypotension.
Regarding IJVarea, it was found to be a highly significant increase in non-hypotensive group (P = 0.001) than hypotensive group in supine position. Then, it reversed in Trendelenburg position as there was statistically significant increase in IJVarea in hypotensive group (P = 0.023), IJV area change rate with position at cut off point ≥ 0.22 had sensitivity and specificity in prediction of hypotension of 100% and 90% respectively. So, the IJV area and ΔIJVarea parameters represented the best predictors.
Several studies were in concordance with the current study results such as Nofal et al., Abdelhamid et al., and Khaled et al., Area is much larger in the hypotensive group when compared to the other group in the Trendelenburg position. Patients who experienced hypotension following spinal anesthesia also showed a substantially higher rate of change in the IJV area in response to changes in patient posture.6,17,18
The current study also demonstrated that IJV collapsibility index is a risk factor to postinduction hypotension. As it was statistically significantly higher in hypotensive group in both supine and Trendelenburg positions (P = 0.001). The cut off was ≥14.05 in prediction of hypotension, with 100% sensitivity and 77% specificity in supine position. While a cut off was ≥16.5 with 100% sensitivity and 71% specificity in Trendelenburg position.
Yeliz et al. Consistent with our results, they discovered that IJV CI was a predictor of hypotension in young, healthy adults having a variety of surgeries done under spinal anesthesia, with a cut-off valuation of 22.6%. Some possible explanations for the large range of cutoff values include variations in the study populations, surgical procedures, and types of anesthesia.19 In the same line, Unluer and Kara, and Killu et al., proved that IJV CI could predict hypovolemia with sensitivity and specificity of 87.5 and 100%.20-21
Not much is known about how to use ultrasound-derived IJV parameters to forecast post-induction hypotension. The effects of posture on the preanesthetic min/max diameters, area of intercostal space, supine and Trendelenburg postures, and their relationships were studied by Okamura et al. Except for the IJV area in the Trendelenburg position, no other variable was found to be an independent predictor of post-induction hypotension. Moreover, another study found that the area of the inferior vena cava (IJV) is a key indicator of a central venous pressure below 5 mmHg.13, 22
The study limitations include a small computed sample size. Secondly, blood pressure was monitored using non-invasive methods every minute for the first 15 min following intubation. However, invasive blood pressure monitoring could be more accurate since it gives real-time data. Thirdly, this study did not account for inspiratory effort. Individuals exhibiting robust inspiratory efforts and elevated tidal volumes may have a greater variability in respiratory changes affecting the central veins.
We conclude that the ultrasound guided measurement of IJV parameters demonstrated a good diagnostic accuracy during both the supine and Trendelenburg positions for predicting post induction hypotensive response; especially, the rate of change in IJV area is a better predictor for post induction hypotension than other parameters.
We recommend more large-scale, multi-center studies to confirm or disprove our findings and identify the factors that put this patient group at risk of hypotension following induction.
7. Data availability
The numerical data generated during this research is available with the authors.
8. Ethical approval
Menoufia University Faculty of medicine Research Ethics Committee; IRB approval number 10/2023 ANET 24 dated October 2023.
9. Trial registration
This trial was registered with Pan African Clinical Trials Registry (PACTR). www.pactr.org with registration number: PACTR202406533026468.
10. Authors’ contribution
NA, YF, NB: Concept, conduction of the study work and manuscript editing
MG, NM: data collection, analysis
Author affiliations:
- Noha A. Afify, Assistant Professor, Department of Anesthesia, Faculty of Medicine, Menoufia University, Shebin El-Kom, Menoufia, Egypt: Email: nohaafify2014@gmail.com; {ORCID:0000-0003-1415-2956}
- Yasser E. Fathi, Assistant Professor, Department of Anesthesia, Faculty of Medicine, Menoufia University, Shebin El-Kom, Menoufia, Egypt: Email: criticalcare65@gmail.com
- Mohamed A. Ghanem, Resident, Department of Anesthesia, National Liver Institute, Menoufia University, Shebin El-Kom, Menoufia, Egypt: Email: mohamed.ghanem2015.mg@gmail.com
- Nagwa I. Mowafy, Lecturer, Department of Anesthesia, National Liver Institute, Menoufia University, Shebin El-Kom, Menoufia, Egypt: Email: Mowafynagwa@gmail.com
- Nadia M. Bahgat, Assistant Professor, Department of Anesthesia, Faculty of Medicine, Menoufia University, Shebin El-Kom, Menoufia, Egypt: Email: dr_nmbahgat@med.menofia.edu.eg
ABSTRACT
Background & objective: Liver cirrhosis has been associated with an elevated risk of perioperative complications and the development of post-induction hypotension (PIH). The purpose of this research was to determine how well changes in the internal jugular vein) IJV (diameter and area can predict post-induction hypotension in cirrhotic patients.
Methodology: A prospective study was conducted in 96 cirrhotic patients, undergoing general anesthesia for surgery, at Department of Anesthesia, Menoufia University hospitals, from October 2023 to September 2024. IJV diameter, area, collapsibility index in supine and Trendelenburg positions and IJV change rate measurements were recorded. A decrease in mean arterial pressure (MAP) by more than 20% of the baseline was defined as ‘hypotension’. A persistent hypotension for ≥ 2 min was defined as ‘prolonged hypotension’. If MAP was reduced by over 40% from the baseline value, it was considered as ‘severe hypotension’.
Results: Hypotension occured in 68% of the participants studied. There was no statistically significant difference between hypotensive and non-hypotensive groups regarding age, sex and baseline mean blood pressure. Δ IJV maximum diameter, ΔIJV minimum diameter, ΔIJV -A, ΔIJV-CI with cut-off point (≥ 0.14, ≤ 0.10, ≥ 0.22, ≥ 0.21 respectively) and sensitivity and specificity of (81% and 97%/ 67% and 77% / 100% and 90% / 78% and 90% respectively) in prediction of hypotension
Conclusion: The ultrasound guided measurement of IJV parameters demonstrated a good diagnostic accuracy during both the supine and Trendelenburg position for predicting postinduction hypotensive response especially, the change rate of IJV area.
Keywords: Internal Jugular Vein; Ultrasonographic Measurement; Hypotension; General Anesthesia; Induction
Citation: Afify NA, Fathi YE, Ghanem MA, Mowafy NI, Bahgat NM. Anaesth. pain intensive care; 2025;29(2):270-277. DOI: 10.35975/apic.v29i2.2715
Received: May 09, 2024; Reviewed: October 26, 2024; Accepted: January 01, 2025
1. INTRODUCTION
Intraoperative hypotension is a condition that has a significant impact on the risk of 30-day mortality, one-year mortality, septic complications, myocardial injury, and acute renal injury in specific patient populations following noncardiac surgery. This condition lacks a universal definition. Preventing an unwanted hypotensive event is crucial for ensuring patient safety. In order to assist clinicians in identifying patients with a modifiable risk level, such as those with impaired preload, it is necessary to identify readily accessible variables.1,2
Volume responsiveness can be predicted by observing how the respiratory cycle affects the variability of the inferior vena cava (IVC) diameter in patients who are on ventilate and breathing on their own but are experiencing circulatory failure, even with nonfatal cardiac arrhythmias. This discovery has implications for the status of volemics. A clinically significant response to bolus fluid administration was considered to be volume responsive in these studies if cardiac output increased by at least 10%.3-5
The objective of the current investigation was to identify patients who were at risk of hypotensive events associated with general anesthesia (GA) in a hemodynamically stable population by evaluating the IJV measurements as a potential screening tool.
2. METHODOLOGY
A prospective double‑blinded controlled trial was conducted during the period from October 2023 to September 2024. The study was started after obtaining the approval of the research ethics committee provided by the Ethical Committee (approval number 10/2023 ANET 24 dated October 2023). It was prospectively registered in the Pan‑African Clinical Trials Registry (PACTR202406533026468) and performed in accordance with the principles of Helsinki declaration.
Child A and B were cirrhotic patients who were scheduled for elective abdominal surgeries that were part of the study. Male and female patients aged 20-60 with a body mass index (BMI) <35 kg/m2.
Morbidly obese patients with BMI >35 kg/m2, a history of cardiac disease, uncontrolled diabetes mellitus, hypertension, pulmonary, or endocrine diseases, renal impairment, pregnancy and emergency surgery, history of radiotherapy or surgery of the neck region, acute liver failure and liver cancers, patients on beta blockers, ACE inhibitors or Angiotensin II receptor blockers (ARBs) , and/or not willing to participate in the study were excluded. A written informed consent was obtained from every patient.
The patient's vital signs, including oxygen saturation (SpO2), non-invasive blood pressure (NIBP), and continuous electrocardiography (ECG), were set up in the operating room on arrival. An 18-gauge cannula was inserted into a peripheral vein to establish a ringer lactate infusion @ 7 mL/kg/h.
The patient was supine and breathing spontaneously at the time of the IJV examination. Ultrasound measurements were conducted with a linear probe on Sonosite-Nanomax ultrasound system, Bothell-USA. The level of the cricoid cartilage was used for all measurements. The initial application of the ultrasound gel was to the side of the neck. Following the application of manual pressure to compress the IJV, a vascular transducer was placed delicately on the neck to differentiate it from the common carotid artery. The IJV area (mm2) and maximum and minimum IJV diameters (dIVCmax and dIVCmin, respectively) were measured at the conclusion of each breathing cycle using M-mode imaging.
The collapsibility index (CI) was calculated using the following formula: CI = (dIVCmax - dIVCmin)/dIVCmax, expressed as percentage. Then the patient was relocated to the 10° Trendelenburg position, and the ultrasonographic measurements were conducted in the same manner. All IJV measurements were conducted by the same senior anesthesiologist.
A second anesthesiologist, who was unaware of the sonographic measurements, induced anesthesia gave 2 mg/kg of propofol and 2 μg/kg of fentanyl intravenously. 0.5 milligrammes per kilogramme of atracurium. Isoflurane 1.2 percent on an oxygen/air mixture with 0.5 percent FiO2 and 0.25 mg/kg of atracurium were used to maintain anesthesia after oral endotracheal intubation, with the help of a TOF guard. With an ETCO2 goal of 35–40 mmHg, the patients were mechanically ventilated. Isoflurane MAC was adjusted so that BIS remained between 40 and 50.
Cardiopulmonary measurements (HR, MAP, and SpO2) were monitored before induction and then every minute for the first fifteen minutes after induction. A drop in mean arterial pressure (MAP) below 20% compared to the baseline value was deemed hypotension. Severe hypotension (MAP decline exceeding 60%) or persistent hypotension (MAP drop lasting 2 minutes or more)
With this definition in hand, we were able to divide our patients into two groups: the hypotensive group and the non-hypotensive group. Hypotensive episodes were treated with 5 mg of ephedrine and heart rate drops below 50 beats per minute with 0.5 mg of atropine. A five microgramme norepinephrine bolus was administered if hypotension persisted despite three consecutive doses of ephedrine or if MAB decease exceeded 60% of baseline.
| Table 1: Baseline characteristics of studied participants (n=96) | |||||
| variable
|
Total
(n=96) |
Hypotensive
(n=65) |
Non-hypotensive
(n=31) |
Test of
significance |
P value |
| Gender
Male Female |
23 (24) 73 (76) |
12 (18.5) 53 (81.5) |
11 (35.5) 20 (64.5) |
χ2=3.34 |
0.068 |
| Age (y)
Mean ± SD Range |
48.10 ± 4.80 39-58 |
48.09 ± 5.66 39-58 |
48.13 ± 2.11 44-52 |
t=0.04 |
0.972 |
| Operation
Lap CCC |
96 (100) |
65 (100) |
31 (100) |
---- | --- |
| HR (beat/min)
Mean ± SD Range |
80.91 ± 7.77 63-94 |
80.75 ± 7.66 63-94 |
81.23 ± 8.12 63-94 |
t=0.27 |
0.787 |
| MAP (mmHg)
Mean ± SD Range |
81.90 ± 5.84 70-100 |
81.83 ± 6.95 70-100 |
82.03 ± 2.24 76-86 |
t=0.16 |
0.875 |
| Data given as n (%), unless specified; P < 0.05 considered as significant | |||||
The purpose of this research was to determine whether there was a correlation between alterations in cirrhotic patients' postinduction hypotension and sizes of their internal jugular veins. Additional results included the collapsibility index, maximum and minimum diameters, and area of the intrajugular vein (IJV) measured in both the supine and Trendelenburg positions. There was also a record of severe hypotension that lasted for a long time after induction.
Sample Size calculation:
according to a review of previous literature (6) The researchers discovered a rate of change (%) in IJV area with an area under the ROC curve of 0.909 (95% CI, 0.833, 0.985), indicating a high degree of discrimination between patients who would develop post-spinal hypotension and those who would not using statistics and version 6 of the sample size preprogram, we were able to determine that 96 subjects would be the minimum sample size. There was an 80% power of the investigation, and the confidence level was 95%.
On an IBM compatible computer, the data was tabulated and analysed using SPSS (Statistical Package for the Social Science) version 26.
Descriptive statistics: number and percentage were expressed (No & %) for qualitative data and mean& SD and range for quantitative data.
Analytic statistics: Qualitative variables were analyzed using Pearson Chi-squared test (χ2) and Fisher exact test, while the quantitative normally distributed variables analyzed using Student t test (t).With the use of receiver operating characteristic (ROC) curve analysis, we sought to ascertain whether IJV measurements could foretell clinically significant post-induction hypotension. To determine the AUC, 95% confidence intervals were utilised. Every parameter's sensitivity, specificity, and optimal cutoff value were calculated.
3. RESULTS
We excluded 14 patients out of 110 who did not meet our eligibility criteria. A total of 96 patients' data sets were examined. The demographic profile (including age, sex, and baseline vital signs, was similar for patients with hypotension and those without it (Table 1). Hypotension occurred in 65 (68%) patients following anesthesia induction, with 2 (3.1%) patients developing severe or persistent hypotension. All hypotensive patients received ephedrine, only 2 patients required additional doses of norepinephrine (Table 2).
IJV parameters (maximum and minimum diameters, maximum area, and collapsibility index) were compared between the hypotensive and non-hypotensive groups whether in supine position (P = 0.003-0.001) or Trendelenburg position (P = 0.023-0.001). Patients who experienced postinduction hypotension had a significantly lower rate of change (P < 0.001) in the measurements with position compared to those who did not (Table 3).
| Table 2: Hypotension among studied participants (n=96) | |||||
| Variable | Total
(n=96) |
Hypotensive (n=65) | Non-hypotensive (n=31) | Test of significance | P value |
| Prolonged hypotension | 44 (45.8) | 44 (67.7) | 0 (0) | χ2=38.47 | <0.001* |
| Severe hypotension | 2 (2.1) | 2 (3.1) | 0 (0) | FE=0.97 | 1.000 |
| Ephedrine boluses
1 2 5 |
--- --- --- |
27 (41.5) 36 (55.4) 2 (3.1) |
--- --- --- |
--- |
--- |
| norepinephrine usage | 2 (3.1) | ||||
| Data given as n (%); *P < 0.05 is statistically significant; χ2: Chi-squared test, FE: Fisher exact test | |||||
| Table 3: Ultra-sonographic measurements of Internal Jugular Vein in supine, Trendelenburg and change rate with positions among studied participants | ||||
| Parameter | Hypotensive (n=65) | Non-hypotensive (n=31) | Sig | P value |
| Maximum IJV diameter (cm)
Supine position Trendelenburg position Change rate with position |
1.54 ± 0.08 1.82 ± 0.09 0.15 ± 0.01 |
1.59 ± 0.06 1.82 ± 0.07 0.13 ± 0.01 |
t=3.13 t=9.67 t=7.57 |
0.003* 0.877 (NS) <0.001* |
| Minimum IJV diameter (cm)
Supine position Trendelenburg position Change rate with position |
1.27 ± 0.06 1.39 ± 0.06 0.09 ± 0.01 |
1.38 ± 0.06 1.53 ± 0.07 0.09 ± 0.00 |
t=8.68 t=9.67 t=3.89 |
<0.001* <0.001* <0.001* |
| IJV area (cm2)
Supine position Trendelenburg position Change rate with position |
1.76 ± 0.09 2.35 ± 0.12 0.24 ± 0.01 |
1.83 ± 0.09 2.29 ± 0.11 0.20 ± 0.01 |
t=3.57 t=2.34 t=16.46 |
0.001* 0.023* <0.001* |
| IJV collapsibility index (%)
Supine position Trendelenburg position Change rate with position |
17.89 ± 1.89 23.34 ± 2.12 0.23 ± 0.04 |
13.17 ± 1.21 15.97 ± 1.31 0.17 ± 0.03 |
t=12.80 t=17.89 t=7.20 |
<0.001* <0.001* <0.001* |
| Data given as mean ± standard deviation; *P < 0.05 is statistically significant; | ||||
| Table 4: Diagnostic accuracy of USG measurements of IJV in Trendelenburg position in prediction of hypotension | ||||
| Accuracy | IJVmax in Trendelenburg position (cm) | IJVmin in Trendelenburg position (cm) | IJV area in Trendelenburg position (cm2) | IJV collapsibility index in Trendelenburg position (%) |
| AUC | 0.523 | 0.927 | 0.601 | 0.995 |
| 95% CI | 0.407-0.639 | 0.872-0.982 | 0.483-0.719 | 0.985-1.000 |
| P value | 0.719 | <0.001* | 0.111 | <0.001* |
| Cut off point | ≤1.82 | ≤1.48 | ≥ 2.32 | ≥16.5 |
| Sensitivity | 52% | 89% | 51% | 100% |
| Specificity | 48% | 81% | 61% | 71% |
| *: Statistically significant, AUC: Area under curve, CI: Confidence interval | ||||
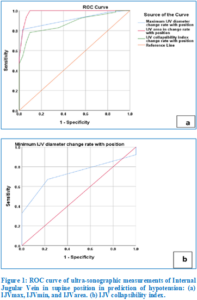
The studied parameters were found to have good diagnostic accuracy in the supine position according to the ROC curve analysis, with AUC values of 0.67 (95% confidence interval = 0.56-0.78; P = 0.007), 0.91 (95% confidence interval = 0.84-0.97; P = 0.001), 0.72 (95% confidence interval = 0.61-0.84; P = 0.001), and 0.98 (95% confidence interval= 0.97-1.000; P < 0.001), respectively. The optimum cut‑off value of IJVmax, IJVmin, IJVarea, and collapsibility index was ≤ 1.59 cm (sensitivity 66%; specificity 52%), ≤ 1.33 cm (sensitivity 83%; specificity 81%), ≤ 1.85 cm (sensitivity 77%; specificity 61%), and ≥ 14.05 cm (sensitivity 100%; specificity 77%) (Figure 1).
The ROC curve analysis also showed that the studied parameters were accurate diagnostic indicators in the Trendelenburg position, with AUC values of 0.52 (95% CI: 0.41-0.64; P = 0.719), 0.93 (95% CI: 0.87-0.98; P < 0.001), 0.60 (95% CI: 0.48-0.72; P = 0.111), and 0.995 (95% CI: 0.99-1.000; P < 0.001), respectively. There was an optimal cut off value of ≤1.82 cm for IJVmax, ≤1.48 cm for IJVmin, ≥ 2.32 cm for IJVarea, and ≥16.5 cm for the collapsibility index, with sensitivity 52% and specificity 48%, sensitivity 51% and specificity 61%, and 100% and 71%, respectively (Table 4).
The area under the curve (AUC) for the rate of change in the studied parameters with respect to position was 0.91 (95% confidence interval= 0.85-0.97; P < 0.001) for IJVmax, 0.73 (95% confidence interval = 0.63-0.83; P < 0.001) for IJVmin, 0.98 (95% confidence interval= 0.96-1.000; P < 0.001) for IJVarea, and 0.87 (95% confidence interval= 0.81-0.94; P < 0.001) for collapsibility index, respectively. The optimum cut‑off value of IJVmax, IJVmin, IJVarea, and collapsibility index was ≥ 0.14cm (sensitivity 81%; specificity 97%), ≤ 0.10 cm (sensitivity 67%; specificity 77%), ≥ 0.22cm (sensitivity 100%; specificity 90%), and ≥ 0.21cm (sensitivity 78%; specificity 90%) respectively (Figure 2).
4. DISCUSSION
The assessment of intravascular volume status continues to be a significant and difficult issue. The volume status is evaluated by combining clinical examination, radiography, and laboratory parameters. However, latent hypovolemia may remain undetected due to its potential to affect organ perfusion and haemodynamics.7
We know a lot about the cardiovascular and vascular complications of cirrhosis. Nitric oxide and other vasoactive molecules cause progressive splanchnic and systemic vasodilation in response to endothelial stretching and stress caused by portal hypertension. Therefore, the hyperdynamic condition continues and the effective central blood volume remains low. Hence, substantial hypotension and decompensation can result from any degree of insult to this system.8,9
During the induction of GA, there is a decrease in peripheral sympathetic tone and a depression of the cardiovascular system, leading to hypotension after the procedure. Conditions such as hypovolaemia and preexisting organ dysfunction can worsen this hypotensive response.10
The evaluation of great veins, including IVC and IJV, using sonography to determine intravascular volume status is becoming increasingly common in acute care settings for tasks such as regional blocks and intravascular volume debt. This is a new area of application for real-time ultrasonography.11,12
Previous studies used a battery of sonographic IJV measurements to identify variables that predicted fluid responsiveness, central venous pressure, and intravascular volume status.13-16
Hypotension during GA induction was the target of this study, which sought to evaluate the diagnostic accuracy of IJV parameters derived from ultrasound in predicting this event. We used a standard method for measuring these parameters and enrolled adult patients with cirrhosis who did not have any clinical predictors.
The present study found 68% of cirrhotic patients developed postinduction hypotension with no preoperative clinical predictors. The ultrasound guided measurement of IJV parameters (IJVmax, IJVmin, IJV area, and CI) demonstrated good diagnostic accuracy during both the supine and Trendelenburg position for predicting this hypotensive response. IJV area was a better predictor for postinduction hypotension than other parameters.
Patients with postinduction hypotension had smaller IJV as measured in the supine and Trendelenburg positions. Hence, those who experienced postinduction hypotension had noticeably higher ΔIJVmax, ΔIJVmin, ΔIJVarea, and ΔIJV CI compared to those who suffered no such thing. comparable to the effect of passive leg raising on shocked patients, demonstrating the rapid transition from supine to Trendelenburg position of the IJV-D. This could suggest a change in intravascular volume. This change can be useful for predicting latent hypovolemia and, by extension, postinduction hypotension.
Regarding IJVarea, it was found to be a highly significant increase in non-hypotensive group (P = 0.001) than hypotensive group in supine position. Then, it reversed in Trendelenburg position as there was statistically significant increase in IJVarea in hypotensive group (P = 0.023), IJV area change rate with position at cut off point ≥ 0.22 had sensitivity and specificity in prediction of hypotension of 100% and 90% respectively. So, the IJV area and ΔIJVarea parameters represented the best predictors.
Several studies were in concordance with the current study results such as Nofal et al., Abdelhamid et al., and Khaled et al., Area is much larger in the hypotensive group when compared to the other group in the Trendelenburg position. Patients who experienced hypotension following spinal anesthesia also showed a substantially higher rate of change in the IJV area in response to changes in patient posture.6,17,18
The current study also demonstrated that IJV collapsibility index is a risk factor to postinduction hypotension. As it was statistically significantly higher in hypotensive group in both supine and Trendelenburg positions (P = 0.001). The cut off was ≥14.05 in prediction of hypotension, with 100% sensitivity and 77% specificity in supine position. While a cut off was ≥16.5 with 100% sensitivity and 71% specificity in Trendelenburg position.
Yeliz et al. Consistent with our results, they discovered that IJV CI was a predictor of hypotension in young, healthy adults having a variety of surgeries done under spinal anesthesia, with a cut-off valuation of 22.6%. Some possible explanations for the large range of cutoff values include variations in the study populations, surgical procedures, and types of anesthesia.19 In the same line, Unluer and Kara, and Killu et al., proved that IJV CI could predict hypovolemia with sensitivity and specificity of 87.5 and 100%.20-21
Not much is known about how to use ultrasound-derived IJV parameters to forecast post-induction hypotension. The effects of posture on the preanesthetic min/max diameters, area of intercostal space, supine and Trendelenburg postures, and their relationships were studied by Okamura et al. Except for the IJV area in the Trendelenburg position, no other variable was found to be an independent predictor of post-induction hypotension. Moreover, another study found that the area of the inferior vena cava (IJV) is a key indicator of a central venous pressure below 5 mmHg.13, 22
5. LIMITATIONS
The study limitations include a small computed sample size. Secondly, blood pressure was monitored using non-invasive methods every minute for the first 15 min following intubation. However, invasive blood pressure monitoring could be more accurate since it gives real-time data. Thirdly, this study did not account for inspiratory effort. Individuals exhibiting robust inspiratory efforts and elevated tidal volumes may have a greater variability in respiratory changes affecting the central veins.
6. CONCLUSION
We conclude that the ultrasound guided measurement of IJV parameters demonstrated a good diagnostic accuracy during both the supine and Trendelenburg positions for predicting post induction hypotensive response; especially, the rate of change in IJV area is a better predictor for post induction hypotension than other parameters.
We recommend more large-scale, multi-center studies to confirm or disprove our findings and identify the factors that put this patient group at risk of hypotension following induction.
7. Data availability
The numerical data generated during this research is available with the authors.
8. Ethical approval
Menoufia University Faculty of medicine Research Ethics Committee; IRB approval number 10/2023 ANET 24 dated October 2023.
9. Trial registration
This trial was registered with Pan African Clinical Trials Registry (PACTR). www.pactr.org with registration number: PACTR202406533026468.
10. Authors’ contribution
NA, YF, NB: Concept, conduction of the study work and manuscript editing
MG, NM: data collection, analysis
11. REFERENCES
- Gu WJ, Hou BL, Kwong JSW, Tian X, Qian Y, Hao J, et al. Association between intraoperative hypotension and 30-day mortality, major adverse cardiac events, and acute kidney injury after non-cardiac surgery: a meta-analysis of cohort studies. Int J Cardiol. 2028;258:68–73. [PubMed] DOI: 1016/j.ijcard.2018.01.137
- Bijker JB, van Klei WA, Vergouwe Y, Eleveld DJ, van Wolfswinkel L, Moons KG, et al. Intraoperative hypotension and 1-year mortality after noncardiac surgery. Anesthesiology. 2009;111:1217–26. [PubMed] DOI: 1097/ALN.0b013e3181c14930
- Huang HJ, Shen QK, Liu YF, Xu H, Fang YX. Value of variation index of inferior vena cava diameter in predicting fluid responsiveness in patients with circulatory shock receiving mechanical ventilation: a systematic review and meta-analysis. Crit Care. 2018;22:204–10. [PubMed] DOI: 1186/s13054-018-2063-4
- Preau S, Bortolotti P, Colling D, Dewavrin F, Colas V, Voisin B, et al. Diagnostic accuracy of the inferior vena cava collapsibility to predict fluid responsiveness in spontaneously breathing patients with sepsis and acute circulatory failure. Crit Care Med. 2017;45:e290–7. [PubMed] DOI: 1097/CCM.0000000000002090
- Bortolotti P, Colling D, Colas V, Voisin B, Dewavrin F, Poissy J, et al. Respiratory changes of the inferior vena cava diameter predict fluid responsiveness in spontaneously breathing patients with cardiac arrhythmias. Ann Intensive Care. 2018;8:79. [PubMed] DOI: 1186/s13613-018-0427-1
- Nofal WH, Sabek EAS, Hussien NS, Wasfy SF. Ultrasonographic evaluation of internal jugular vein for the prediction of post-spinal hypotension in orthopedic surgeries. Sri Lankan J Anaesthesiol. 2023;31(1):30–40. DOI: 4038/slja.v31i1.8965
- Bennett VA, Cecconi M. Perioperative fluid management: from physiology to improving clinical outcomes. Indian J Anaesth. 2017;61:614–21. [PubMed] DOI: 4103/ija.IJA_456_17
- Olson JC, Karvellas CJ. Critical care management of the patient with cirrhosis awaiting liver transplant in the intensive care unit. Liver Transpl. 2017;23:1465–76. [PubMed] DOI: 1002/lt.24815
- Iwakiri Y, Groszmann RJ. The hyperdynamic circulation of chronic liver diseases: from the patient to the molecule. Hepatology. 2006;43:S121–31. [PubMed] DOI: 1002/hep.20993
- Lonjaret L, Lairez O, Minville V, Geeraerts T. Optimal perioperative management of arterial blood pressure. Integr Blood Press Control. 2014;7:49–59. [PubMed] DOI: 2147/IBPC.S45292
- Szabó M, Bozó A, Darvas K, Horváth A, Iványi ZD. Role of inferior vena cava collapsibility index in the prediction of hypotension associated with general anesthesia: an observational study. BMC Anesthesiol. 2019;19:139. [PubMed] DOI: 1186/s12871-019-0809-4
- Kılıç Y, Bas SS, Kayhan GE, Güleç MS. Internal jugular vein ultrasonography in prediction of postspinal hypotension. J Coll Physicians Surg Pak. 2020;30(12):1256–61. [PubMed] DOI: 29271/jcpsp.2020.12.1256
- Avcil M, Kapci M, Dagli B, Omurlu IK, Ozluer E, Karaman K, et al. Comparison of ultrasound-based methods of jugular vein and inferior vena cava for estimating central venous pressure. Int J Clin Exp Med. 2015;8(7):10586–94. [PubMed]
- Hilbert T, Ellerkmann RK, Klaschik S, Putensen C, Thudium M. The use of internal jugular vein ultrasonography to anticipate low or high central venous pressure during mechanical ventilation. J Emerg Med. 2016;50(4):581–7. [PubMed] DOI: 1016/j.jemermed.2015.11.033
- Hossein-Nejad H, Mohammadinejad P, Ahmadi F. Internal jugular vein/common carotid artery cross-sectional area ratio and central venous pressure. J Clin Ultrasound. 2016;44(5):312–8. [PubMed] DOI: 1002/jcu.22339
- Prekker ME, Scott NL, Hart D, Sprenkle MD, Leatherman JW. Point-of-care ultrasound to estimate central venous pressure: a comparison of three techniques. Crit Care Med. 2013;41(3):833–41. [PubMed] DOI: 1097/CCM.0b013e31827466b7
- Abdelhamid BM, Ahmed A, Ramzy M, Rady A, Hassan H. Pre-anaesthetic ultrasonographic assessment of neck vessels as predictors of spinal anaesthesia-induced hypotension in the elderly: a prospective observational study. Egypt J Anaesth. 2022;38(1):349–56. DOI: 1080/11101849.2022.2082051
- Khaled D, Fathy I, Elhalafawy YM, Zakaria D, Rasmy I. Comparison of ultrasound-based measures of inferior vena cava and internal jugular vein for prediction of hypotension during induction of general anesthesia. Egypt J Anaesth. 2023;39(1):87–94. DOI: 1080/11101849.2023.2171548
- Kilic Y, Bas SS, Kayhan GE, et al. Internal jugular vein ultrasonography in prediction of postspinal hypotension. J Coll Physicians Surg Pak. 2020;30(12):1256. [PubMed] DOI: 29271/jcpsp.2020.12.1256
- Unluer EE, Kara PH. Ultrasonography of jugular vein as a marker of hypovolemia in healthy volunteers. Am J Emerg Med. 2013;31(1):173–7. [PubMed] DOI: 1016/j.ajem.2012.07.003
- Killu K, Coba V, Huang Y, Andrezejewski T, Dulchavsky S. Internal jugular vein collapsibility index associated with hypovolemia in intensive care unit patients. Crit Ultrasound J. 2010;2:13–7. DOI: 1007/s13089-010-0034-3
- Okamura K, Nomura T, Mizuno Y, et al. Pre-anesthetic ultrasonographic assessment of the internal jugular vein for prediction of hypotension during induction of general anesthesia. J Anesth. 2019;33(5):612–9. [PubMed] DOI: 1007/s00540-019-02675-9